


Dacast Analytics Dashboard: An Intro to Key Features

Table of Contents
- 3 Things to Know About Your Analytics Dashboard
- 1. Timezone Settings
- 2. Start Date of the Data Collection for the New Graphs
- 3. Conditions of Data Collection
- How to Read Your Video Analytics Data
- How Long Does it Take for the Dacast Analytics Dashboard to Populate?
- Analytics per Content
- Additional Resources
Advanced video analytics are used to help broadcasters assess the performance of their videos. This information can be used to shape future live streams and other videos.
3 Things to Know About Your Analytics Dashboard
Let’s see how does video analytics work. There are three main features to take note of when navigating the new Dacast analytics dashboard.
1. Timezone Settings
Your analytics data of “Dashboard” and “Engagement” are provided in your local time (for example, if you are in NYC, it will provide data in EST).
2. Start Date of the Data Collection for the New Graphs
Among the changes are new graphs with new metrics. These new graphs have started to collect data since July 29, 2018. This is specified under each graph affected. Please take that into consideration when analyzing a longer time period.
Regarding the new revenue section, please note that the data displayed is starting from the date of the first use of the new paywall.
3. Conditions of Data Collection
The new graphs located in the dashboard and engagement sections collect data via Dacast default player only.
If you are using Dacast M3U8 live channels or a custom player, the data won’t be tracked. The same applies if you are playing your content via a TV set-up box or a mobile app that is not using our player.
If you are using a custom player or playing your content via a TV set-up box or a custom player within the context of your mobile app, you will only access the consumption of data per time.
The revenue analytics section, however, is collecting your data through the new paywall, independently of the player used.
How to Read Your Video Analytics Data
The dashboard gives you an analysis of your overall content and provides you the following general information: data usage, audience, engagement, paywall, plays by location, and top 10 content.

To read the information on the Dacast video analytics, start by selecting:
- A specific time period:

Once you’ve clicked on the time frame your data will appear for that selected time.
- Content Type Filter
You can also filter or retrieve analytics data for live stream and video content by selecting the ones you need. Simply click on the “Content Type Filter” button and select the content for which you want to display analytics.

This feature can only be done with the following tabs in the global Analytics section:
- Dashboard
- Data Usage
- Storage Usage
- Audience
- Engagement
Metrics
One of the most important things to know about reading the Dacast analytics is what the graphs are measuring.
Here’s what you need to know about the metrics:
- Unique viewer metrics: This allows you to see the number of individuals who watch your videos, no matter how many times they have viewed your video.
- Tooltips are available to explain what each metric is about
- Data usage: the amount of data used (GBs).
- Audience: number of times your audience played your videos.
- Engagement: number of hours your audience spent viewing your content.
- Paywall: your earnings.
- Plays by Location: countries, regions and cities where your viewers have been playing your content.
- Top 10 Content: your content that works best based on the number of viewers and revenue.
– All stats per hour can be reviewed only for the last 24h
– All stats per day can be reviewed only for the last 30 days
– In all stats for more than 30 days back in time the data consumption is accumulated for the entire month
On the right side of the cards showing data usage, audience, engagement, and paywall, you will see a “See more” option and by clicking on it, you will be redirected to the different tabs of the analytics section and will see further information.
Data Usage
In your analytics dashboard, you will see your GBs consumption during the selected period.

By clicking on “Data Usage”, you will see the details of your data usage by time as shown below. Data usage can be displayed for live streams and vod events.

Audience
On the right side of the data usage card, you will see “Audience”. In the general dashboard, you will only see the overall number of times your audience played your videos for the period you selected.

By clicking on “Audience”, you will be able to see the Plays (number of times viewers clicked “play” on your video), Impressions (number of times your video player has been displayed to your viewers) and Unique viewers (number of individuals who watch your videos, no matter how many times) by time, device, and location as shown below:
Plays / Impressions / Unique Viewers By Time:

Plays / Impressions / Unique Viewers By Device/Browser:

Plays / Impressions / Unique Viewers By Location:

The list of cities, regions and countries should be sorted out by number of plays (the highest number on top) while scrolling.
Engagement
To the right of the Audience card, you will see “Engagement”. In the general dashboard, you will only see the overall number of hours your viewers have been engaging/viewing with your video content, for the time range you’ve selected.

By clicking on the options in the upper right corner, you will be able to see the engagement details by time, device/browser, and location as shown in the following sections below.
Engagement / Unique Viewers By Time:

Engagement / Unique Viewers By Device/Browser:

Engagement / Unique Viewers By Location:

Paywall
To the right of the Engagement card, you will see “Paywall”. In the general dashboard, you will only see the overall earnings, for the time range you’ve selected.
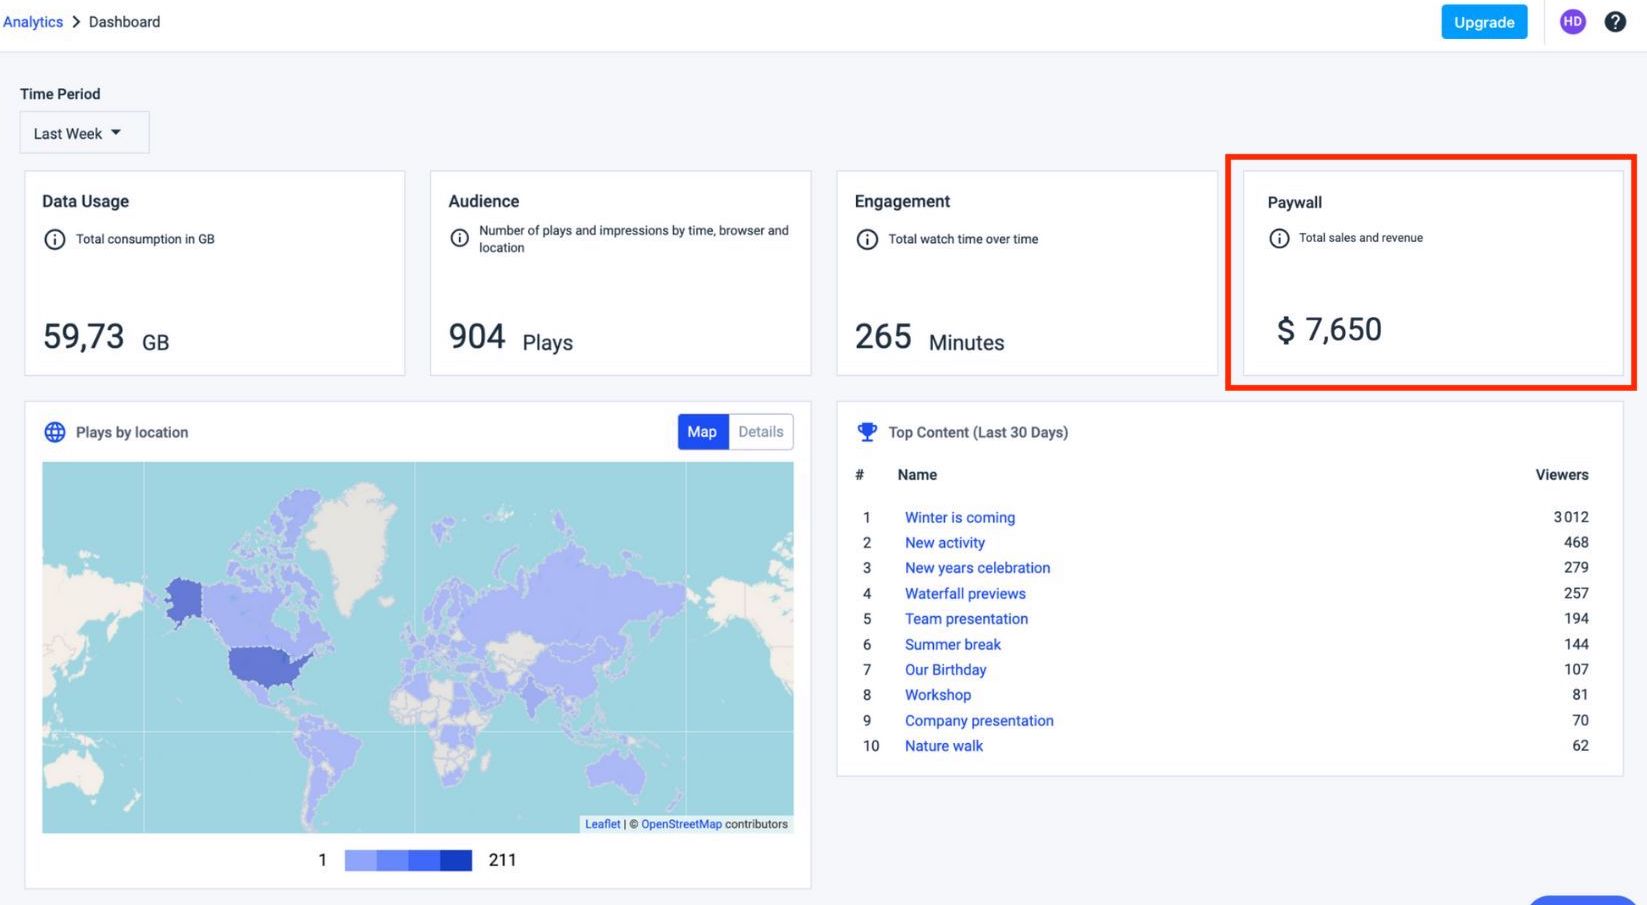
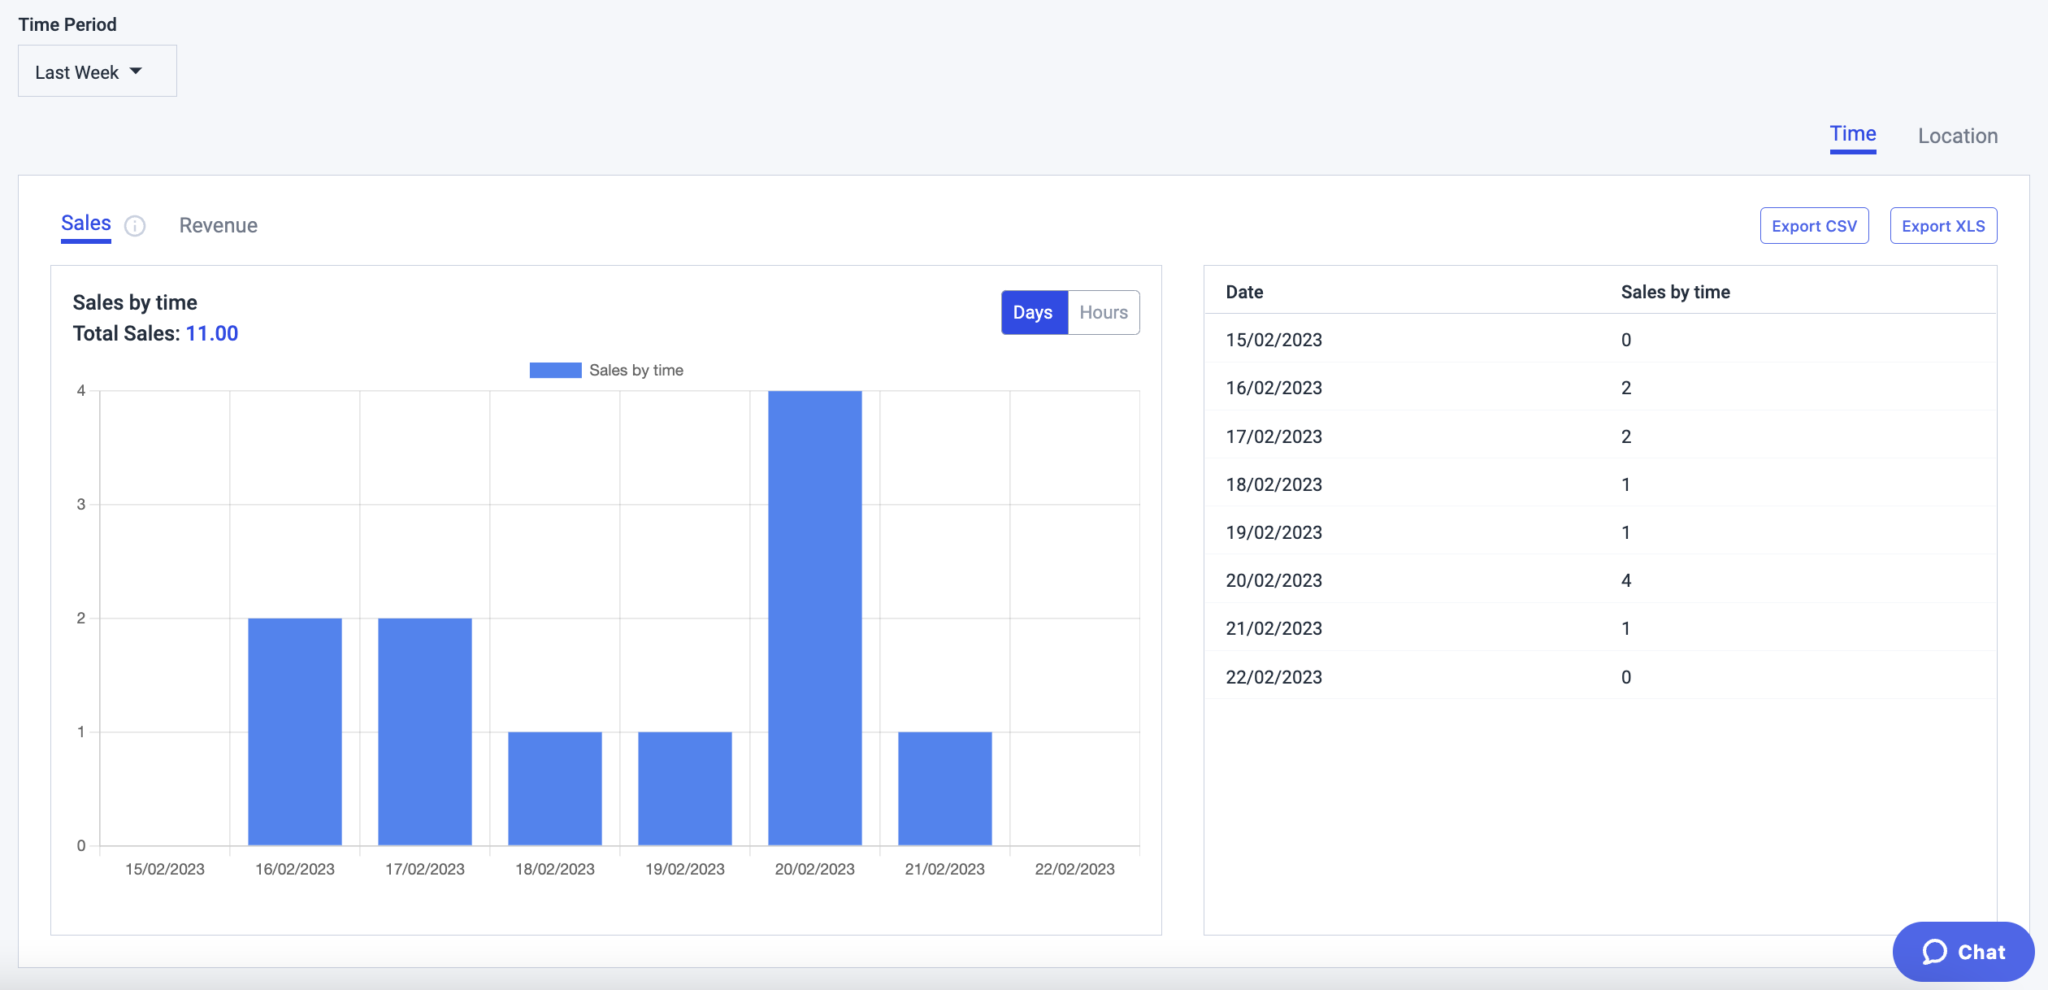
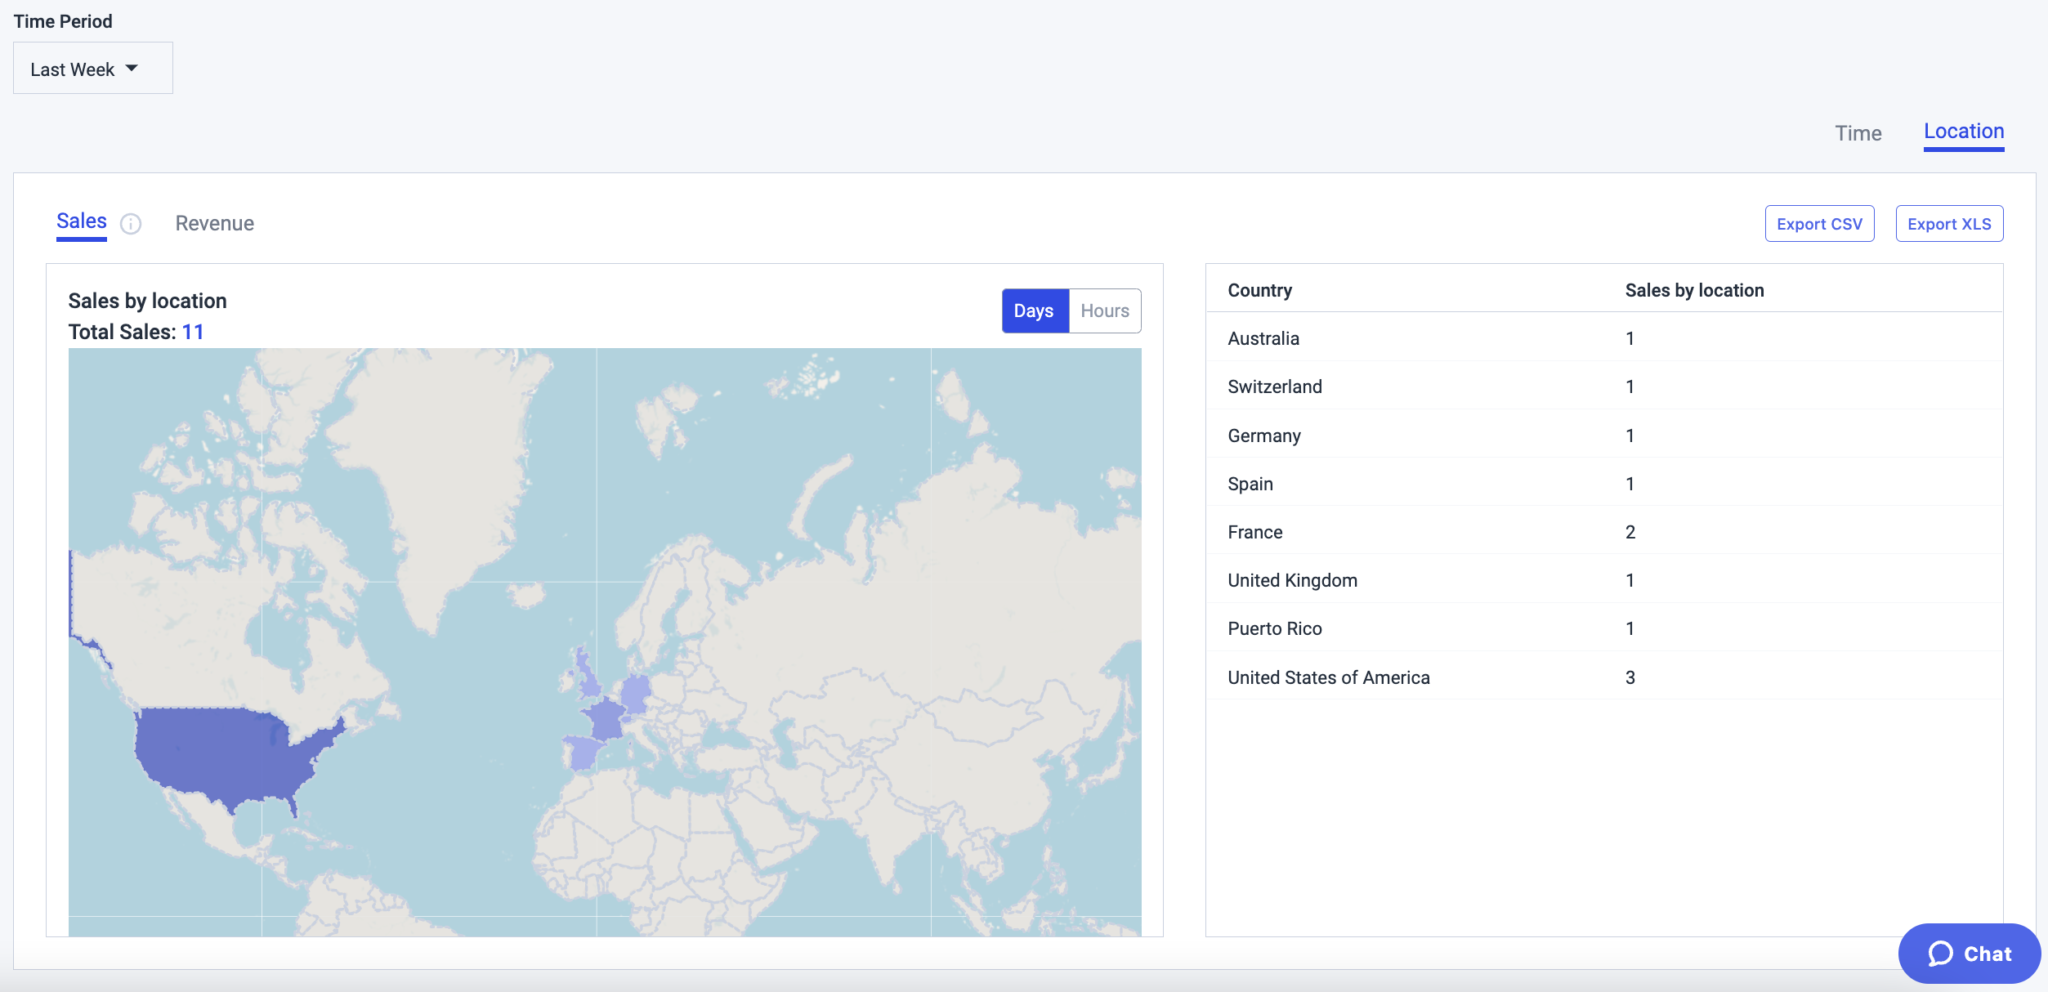
By clicking on “Paywall”, you will be able to see the number of sales and your revenues by time and location as shown below.
By time:
By Location:
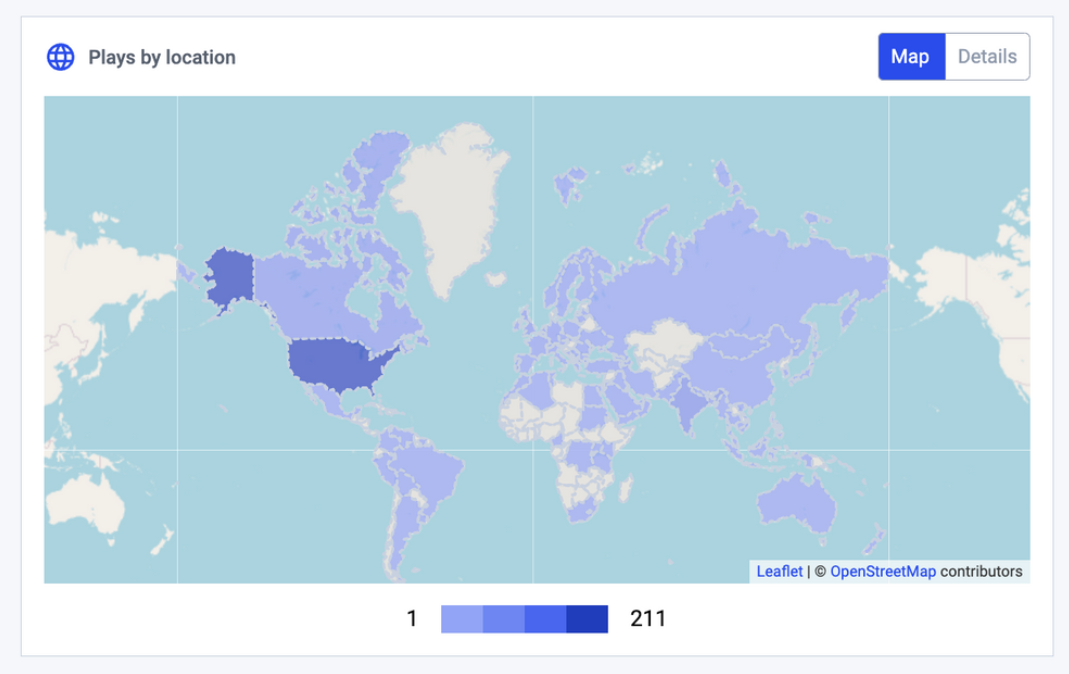
Plays by Location
Finally, you will see the plays by location. In this map, you will be able to see the number of plays by country, region and cities for the time range you have selected.
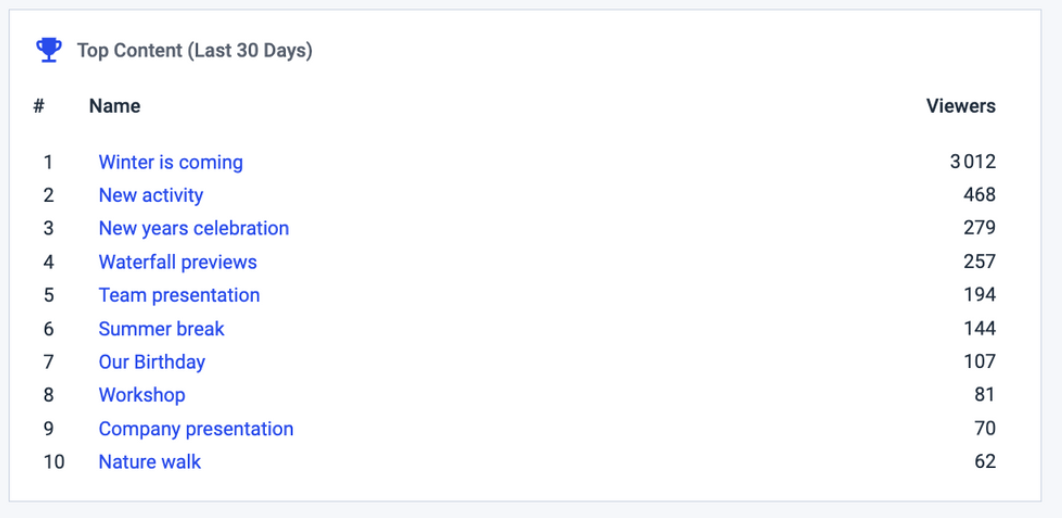
Top 10 Content
Finally, you will see your top 10 content. By clicking on your top 10 content titles, you will see your analytics details for each video content (audience, paywall, engagement; and real time video analytics for live only).
Note that any deleted content won’t appear in the top content.
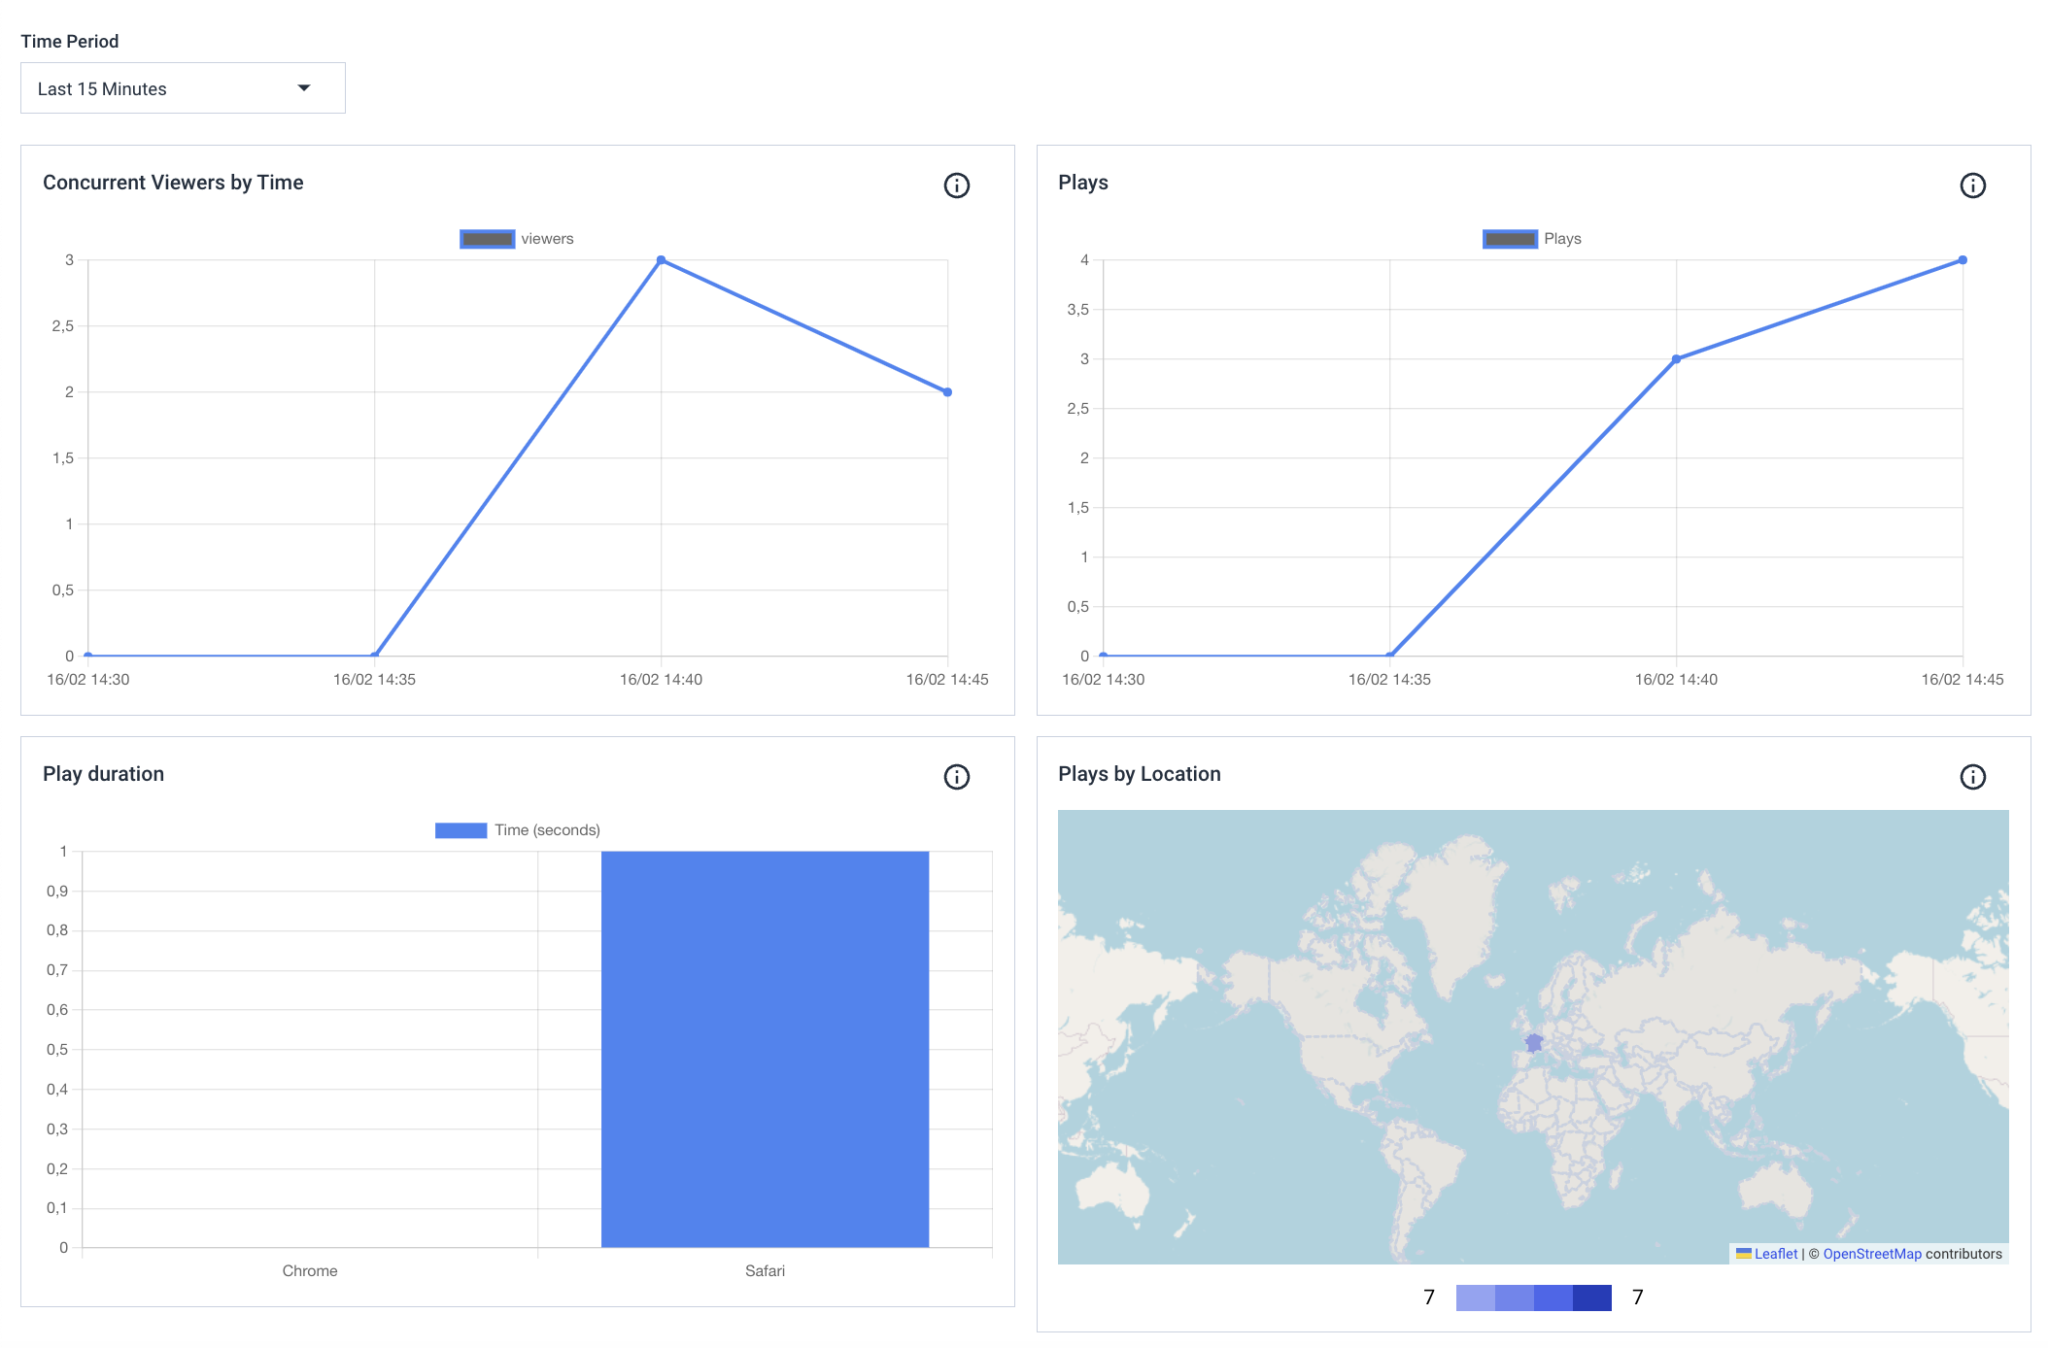
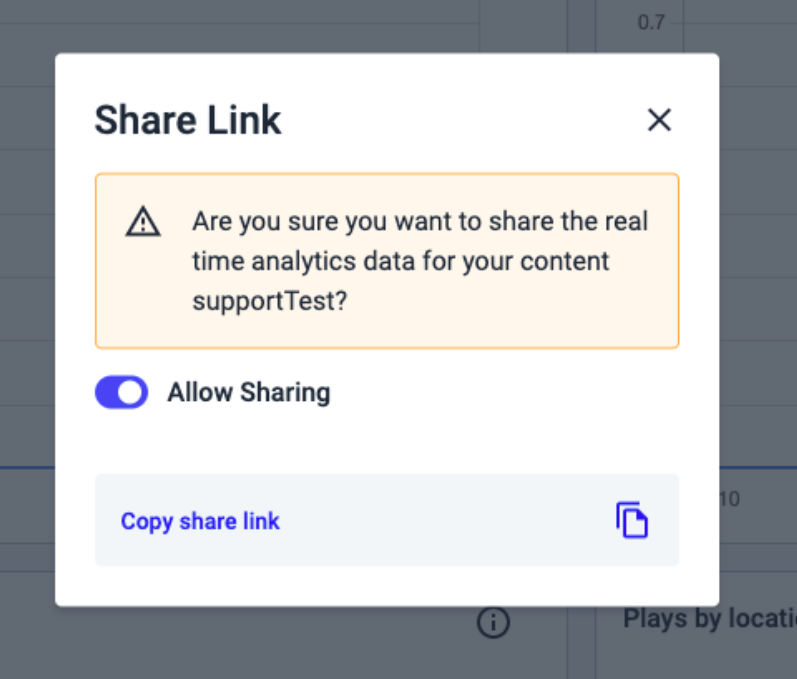
Real Time Analytics
Real time Analytics gives you real time stats about your Live Stream. Now you can even share those charts via the Real Time Analytics sharing feature. Just click on Share Link in the upper right corner.
How Long Does it Take for the Dacast Analytics Dashboard to Populate?
Your Dacast Analytics Dashboard will populate in real-time video analytics within your account.
The Dashboard section will help you to understand your viewers’ engagement and will provide you with the following information:
- Data usage
- Audience
- Engagement
- Paywall
- Plays by location
- Top 10 content
Analytics per Content
We’ve reviewed how to read the analytics in the main analytics section to get a general overview of your content performance. Now, suppose you want to understand better how your viewers consume a specific live stream or video on demand. In that case, we invite you to take a look at the following written article about how per content analytics works and what are real time analytics benefits.
Any questions or need help/access to this feature? Please contact us. Not yet a Dacast user, and interested in trying Dacast risk-free for 14 days? Sign up today to get started.
Additional Resources
- Explore Real-Time Analytics on Dacast
- How to Link Google Analytics to Your Dacast Account
- How to Access and Read Your Analytics Revenue from Dacast
- Walkthrough to Per Content Video Analytics on Dacast
- New Advanced Video Analytics VOD and Live Streaming
- How Long Does it Take for the Dacast Analytics Dashboard to Populate?
- Dacast Revenue Analytics: How to Read the Graphs
- Dacast Analytics: How to Read the Graphs
- Dacast’s Analytics Dashboard: How to read the graphs
- More on Advanced Analytics