


Walkthrough to Per Content Video Analytics on Dacast

Let’s find out more about our in-house build Video Analytics Technology!
If you want to better understand how your viewers consume a specific live stream or video on demand, you can now do it with per content analytics on Dacast. To see the analytics of a specific piece of video content, you must select the live stream or video of your choice and go to the “Analytics” tab as shown below:
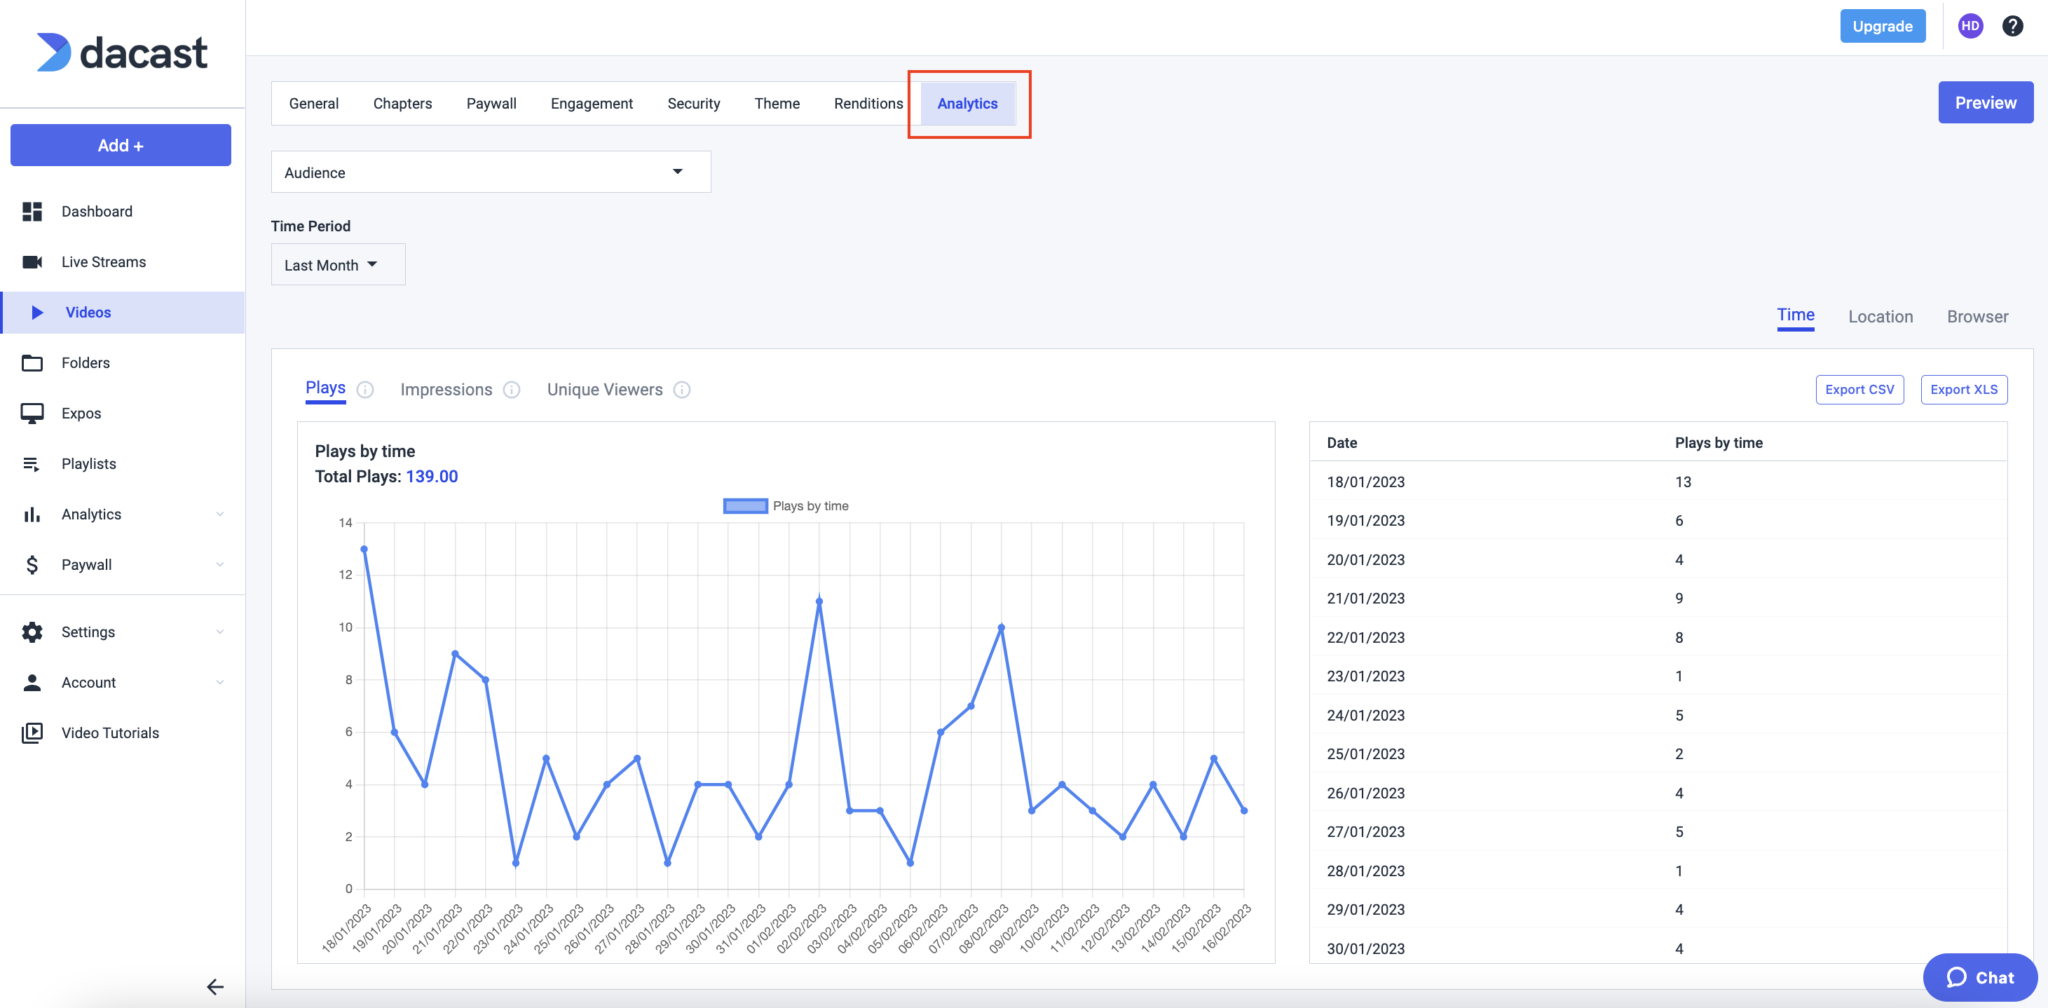
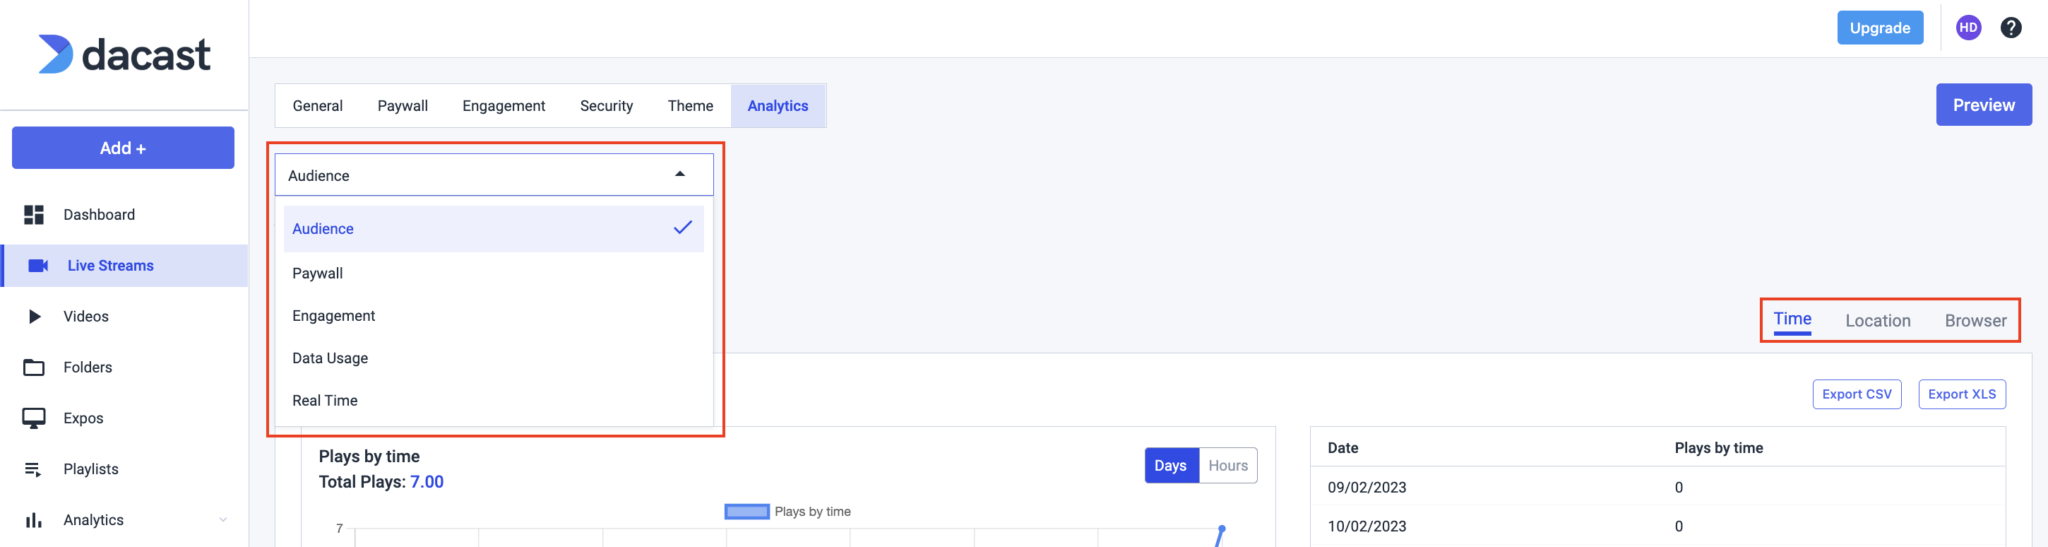
In this tab, you will see three different views: by time, device, and location. You will also see four different types of data:
- Audience
- Paywall
- Engagement
- Real time video analysis (only available for live streams)
Let’s take a closer look at the different options available in the analytics tab of your videos and live streams.
1. Audience
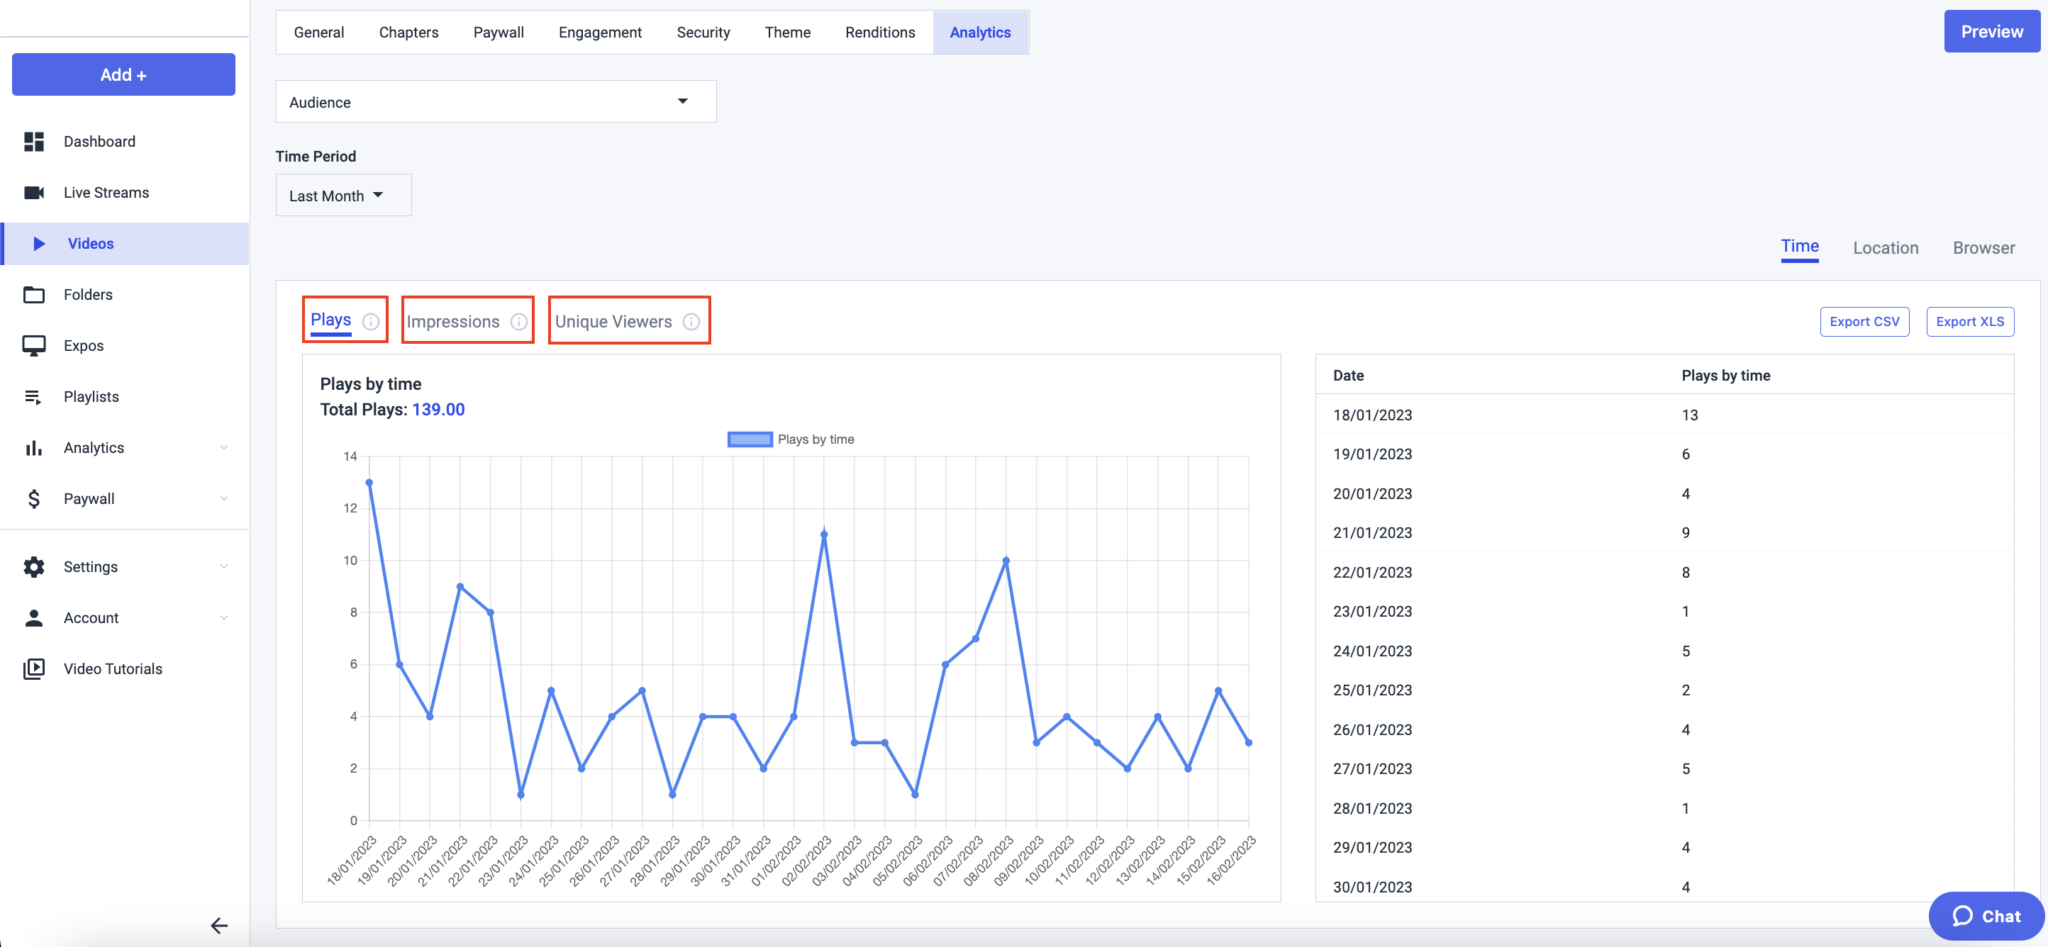
With Audience, you can observe who is watching your content, when (Time), from what device (Device/Browser), and from which country (Location) as shown below. You have full video view analytics.
The parameters you can track for each aspect are Plays, Impressions and Unique Viewers:
Plays/Impressions/Unique Viewers By Time
Plays/Impressions/Unique Viewers By Device/Browser Plays/Impressions/Unique Viewers By Location
2. Engagement
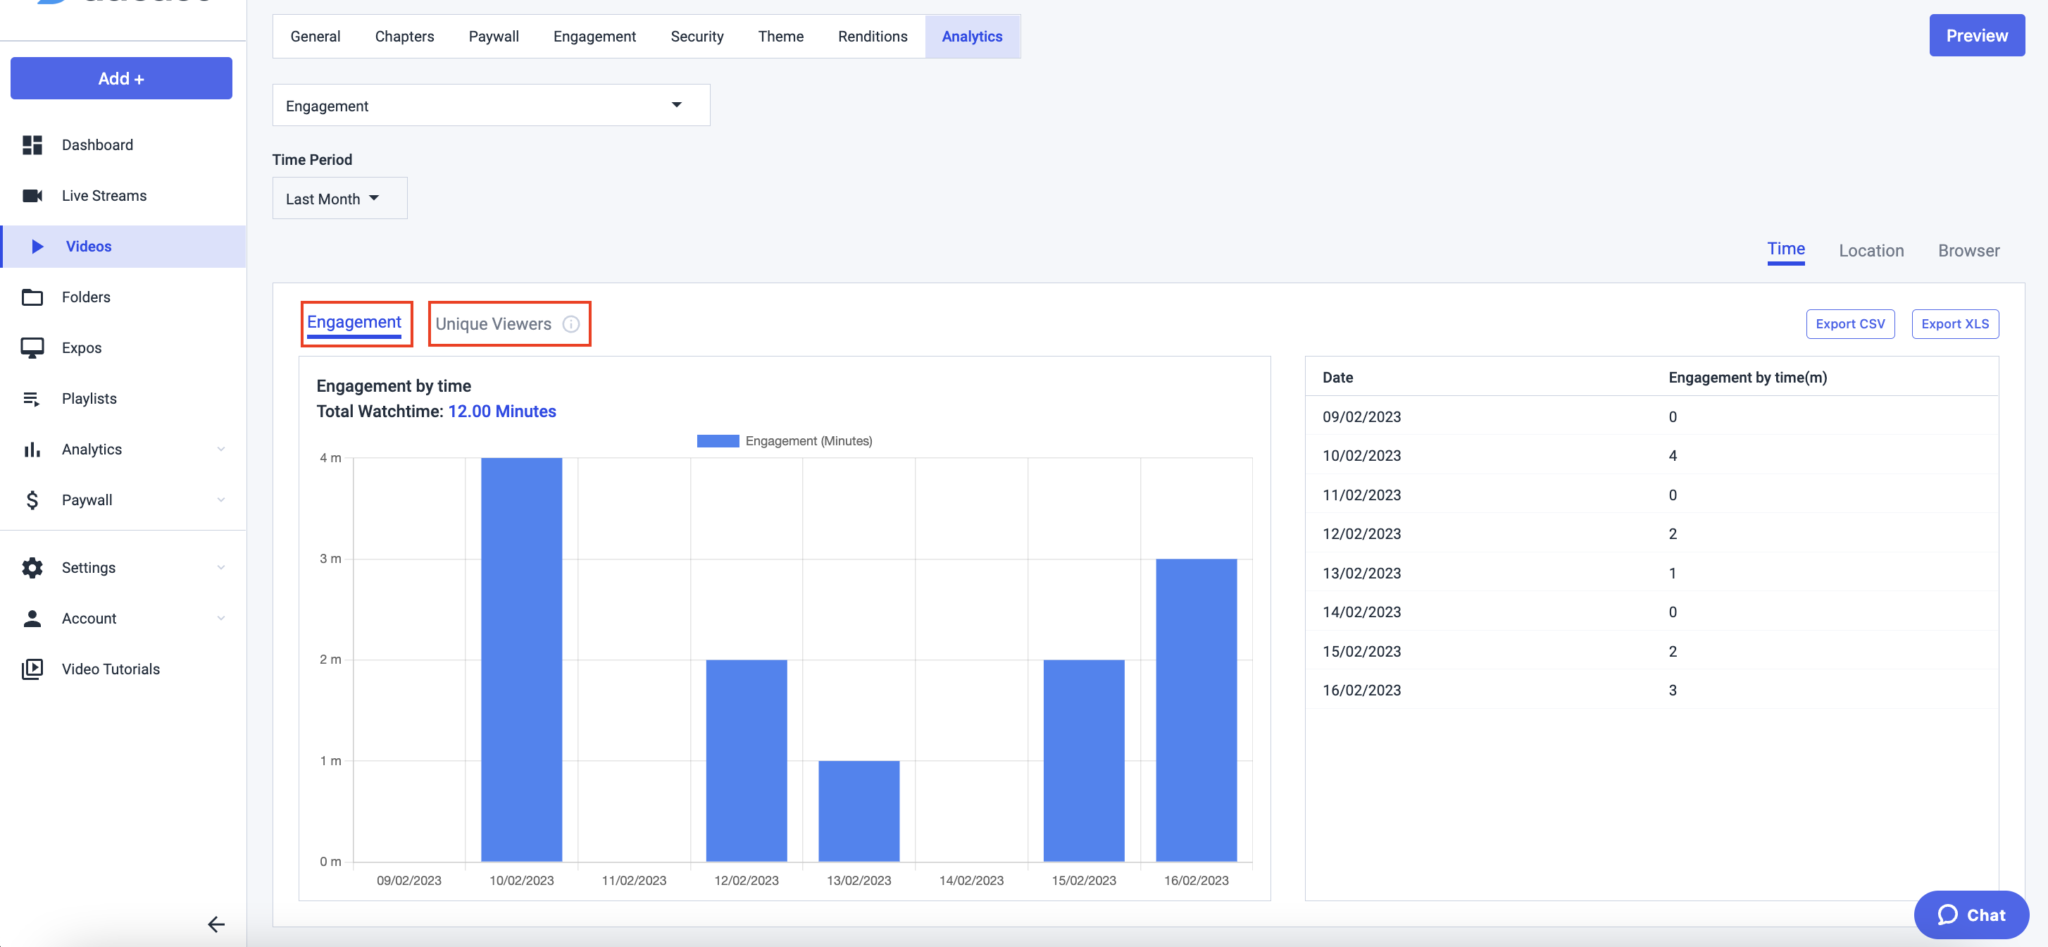
With Engagement, you can see your video content engagement based on the time, device/browser, or location as shown below.
The parameters you can track for each aspect are Engagement and Unique Viewers:
Engagement/Unique Viewers By Time
Engagement/Unique Viewers By Device/Browser
Engagement/Unique Viewers By Location
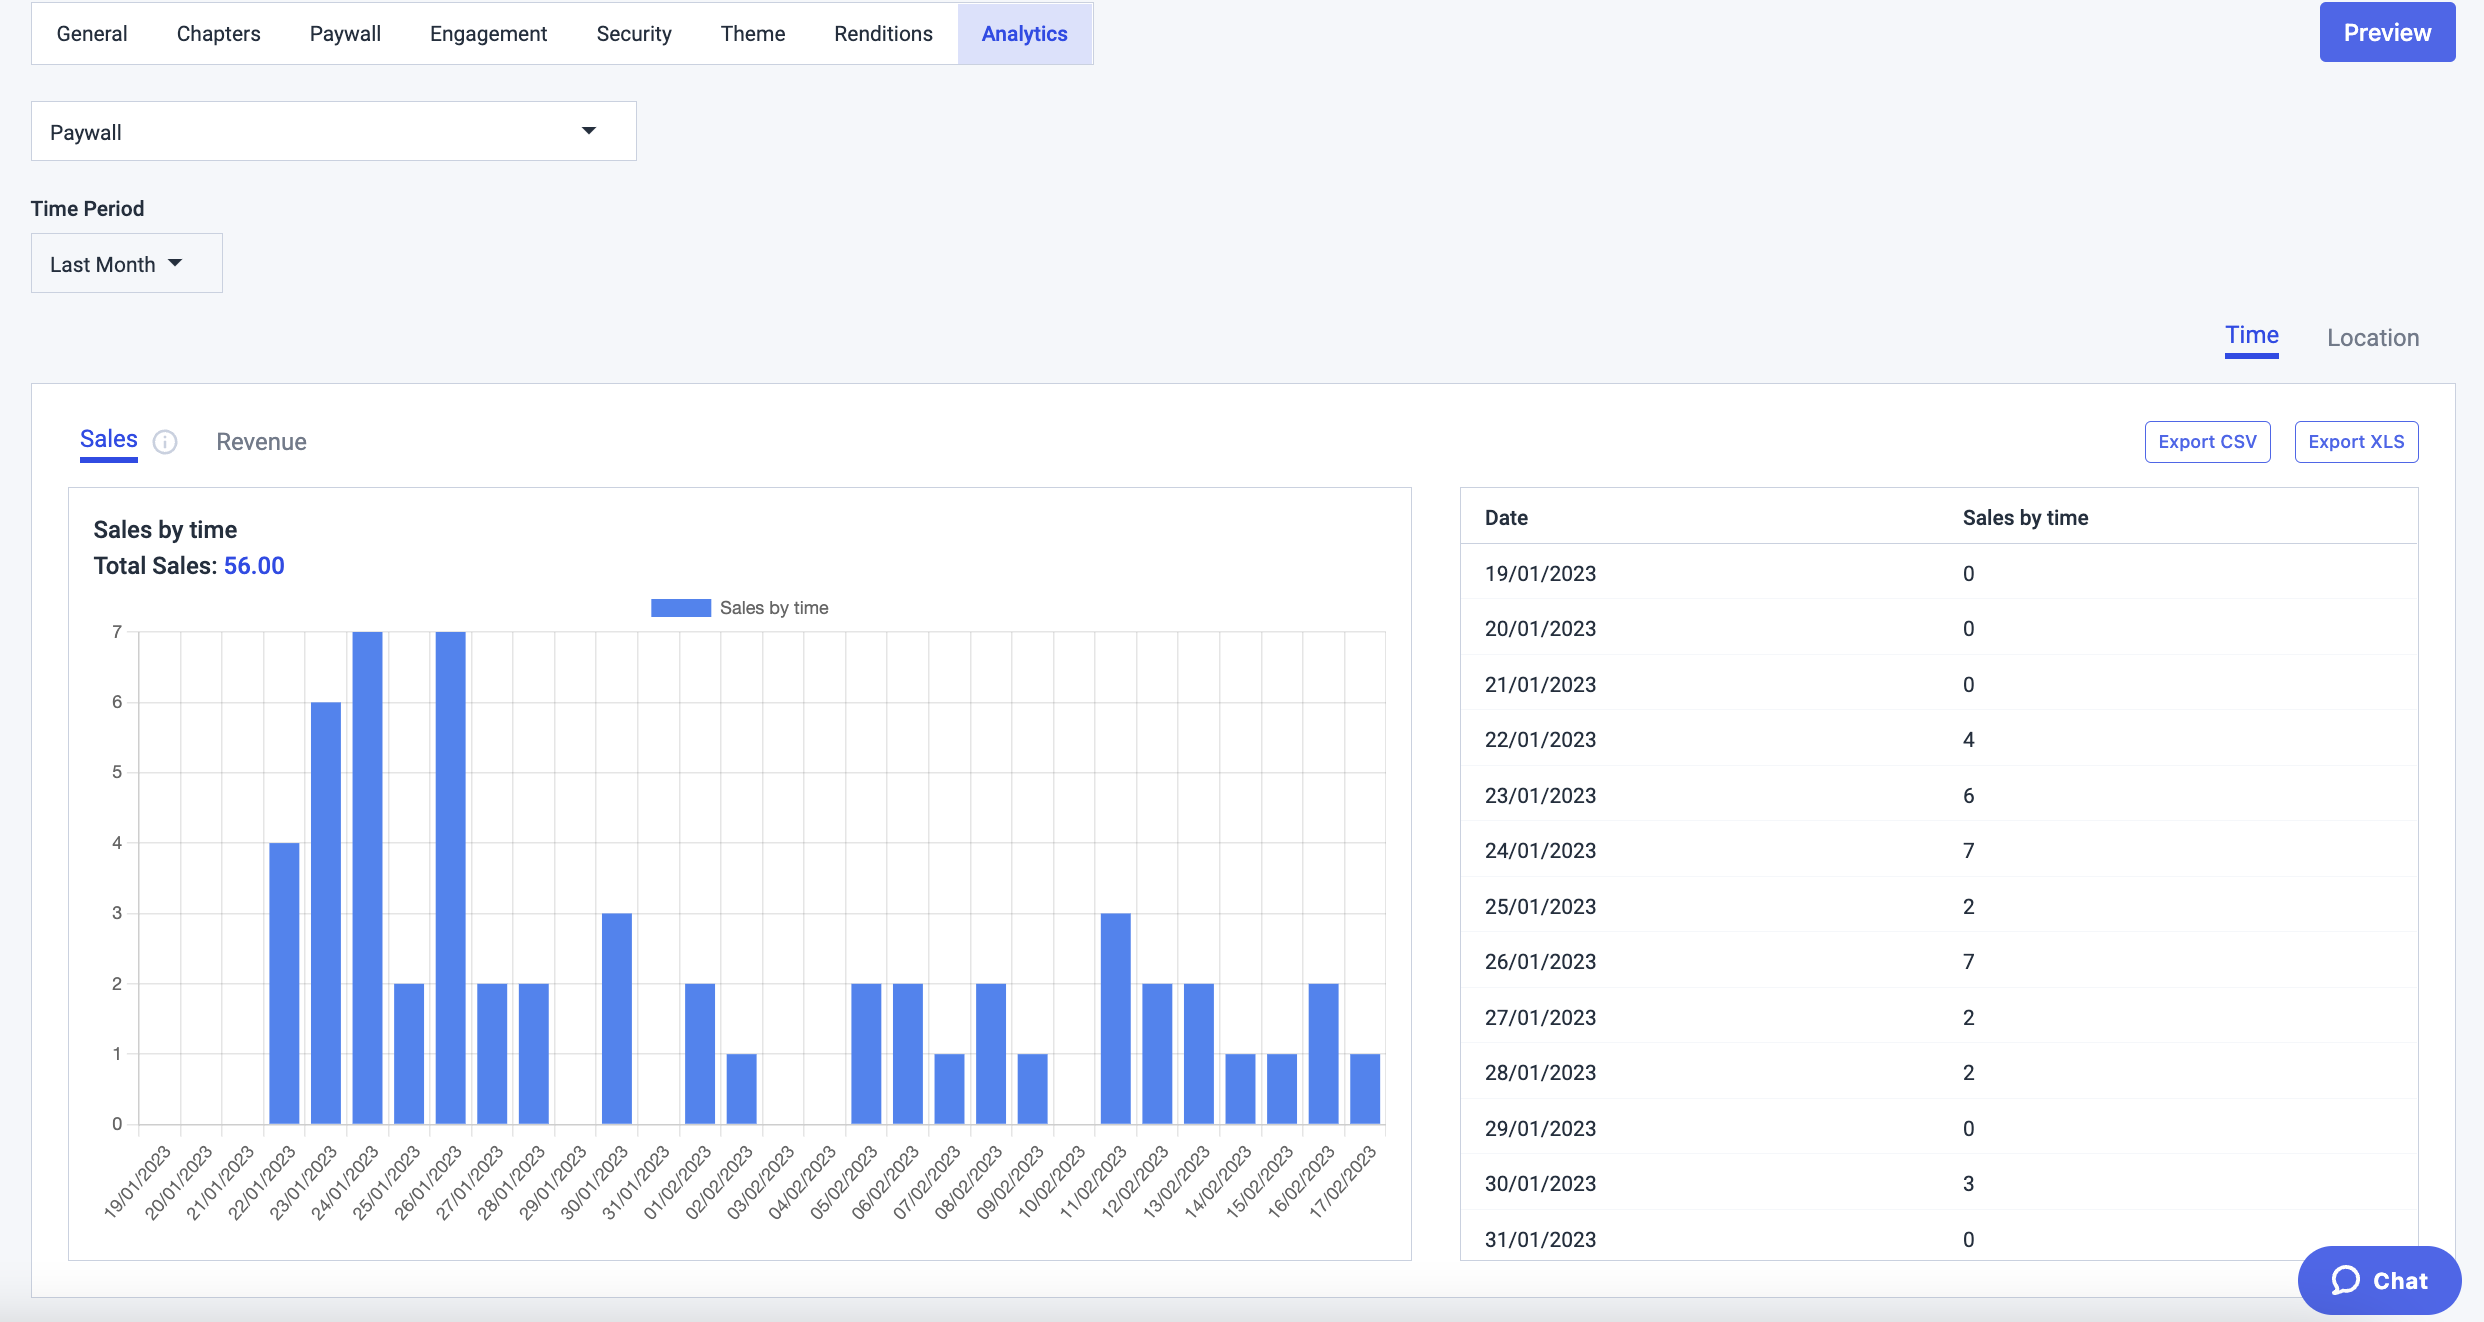
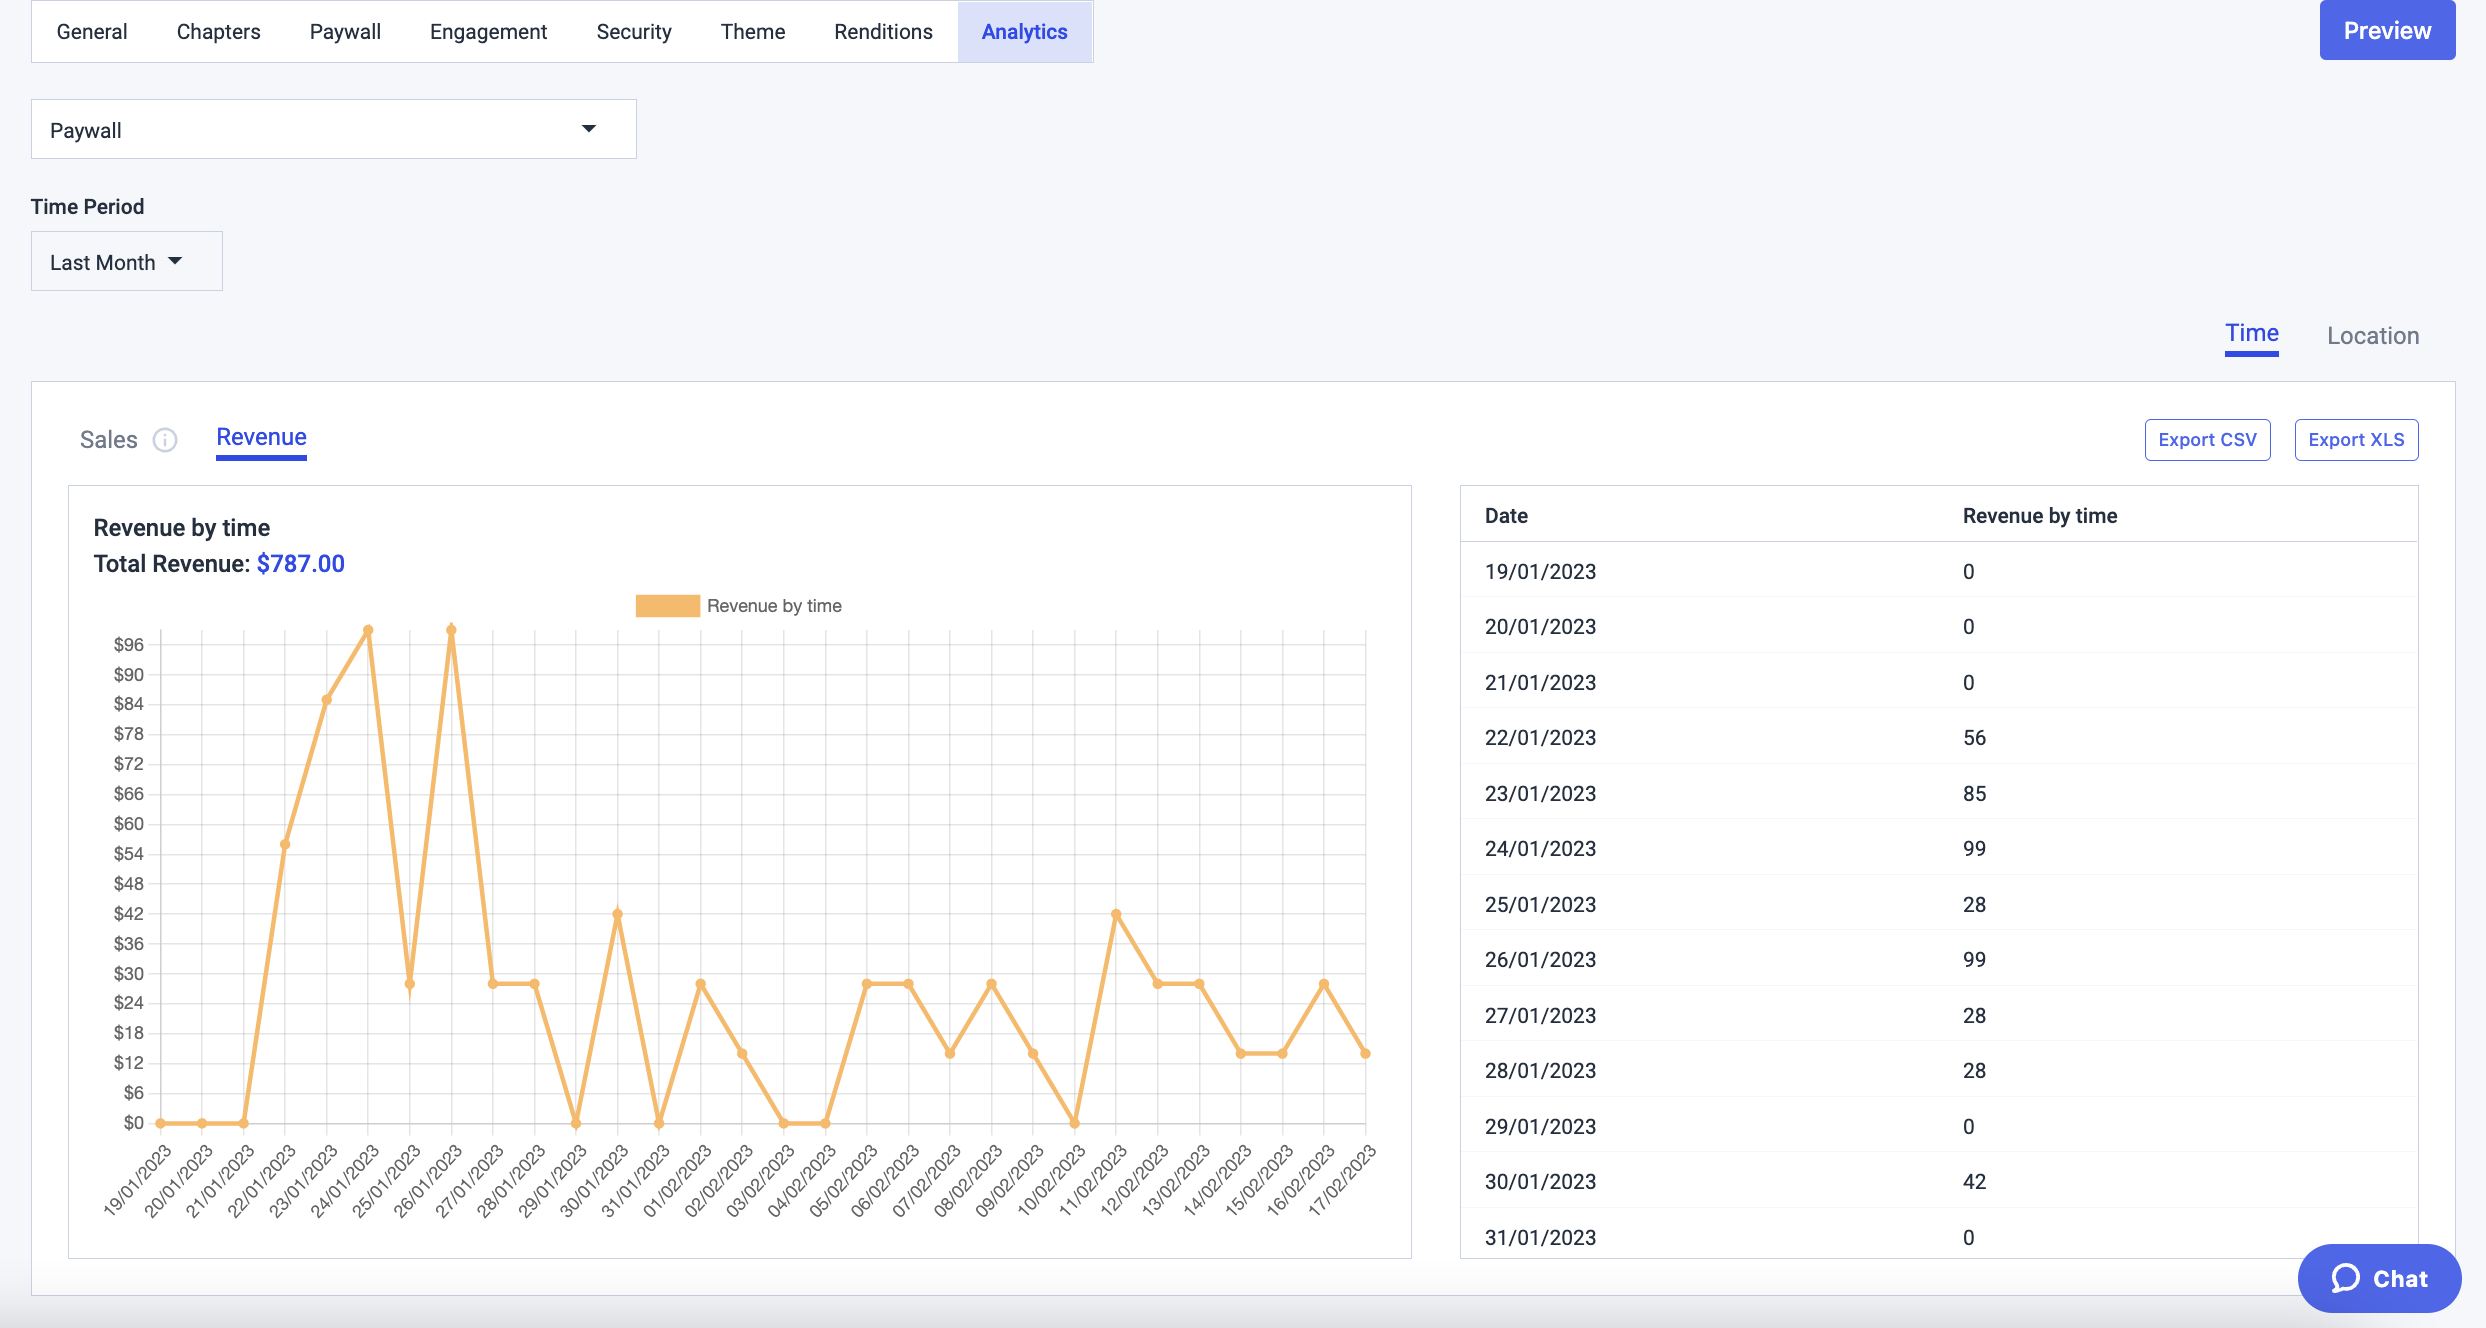
3. Paywall
If you are monetizing your content, you can view paywall analytics, as well. With this option, you will be able to know when and where you are generating more sales as shown below:
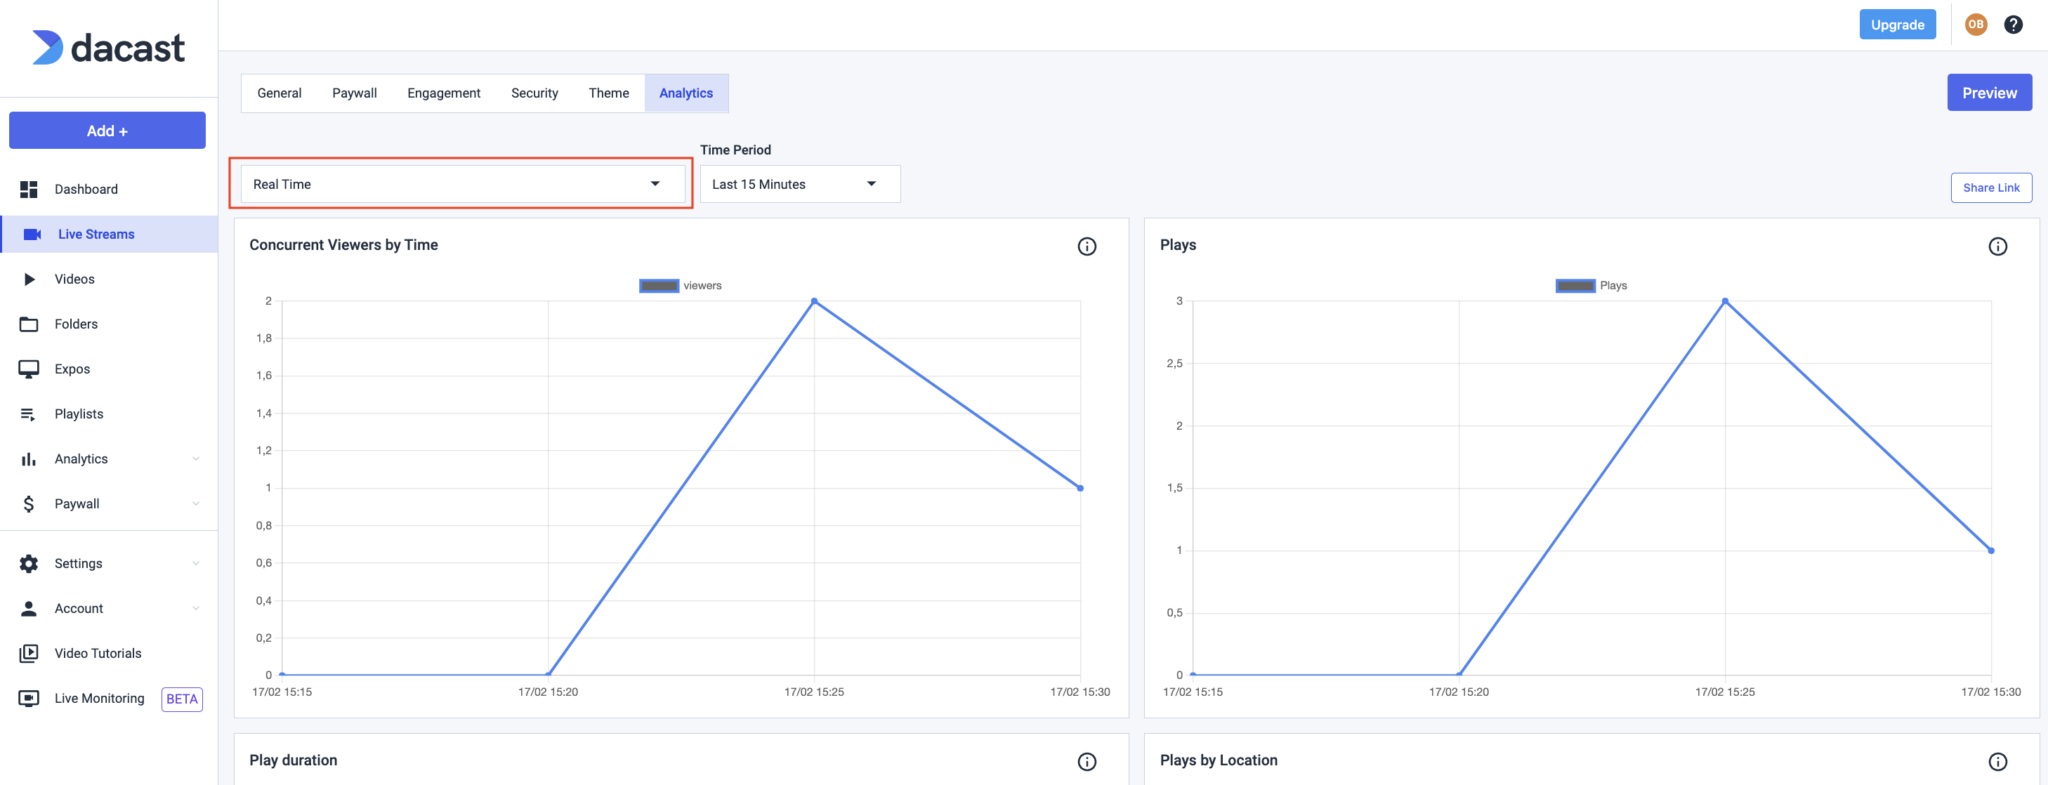
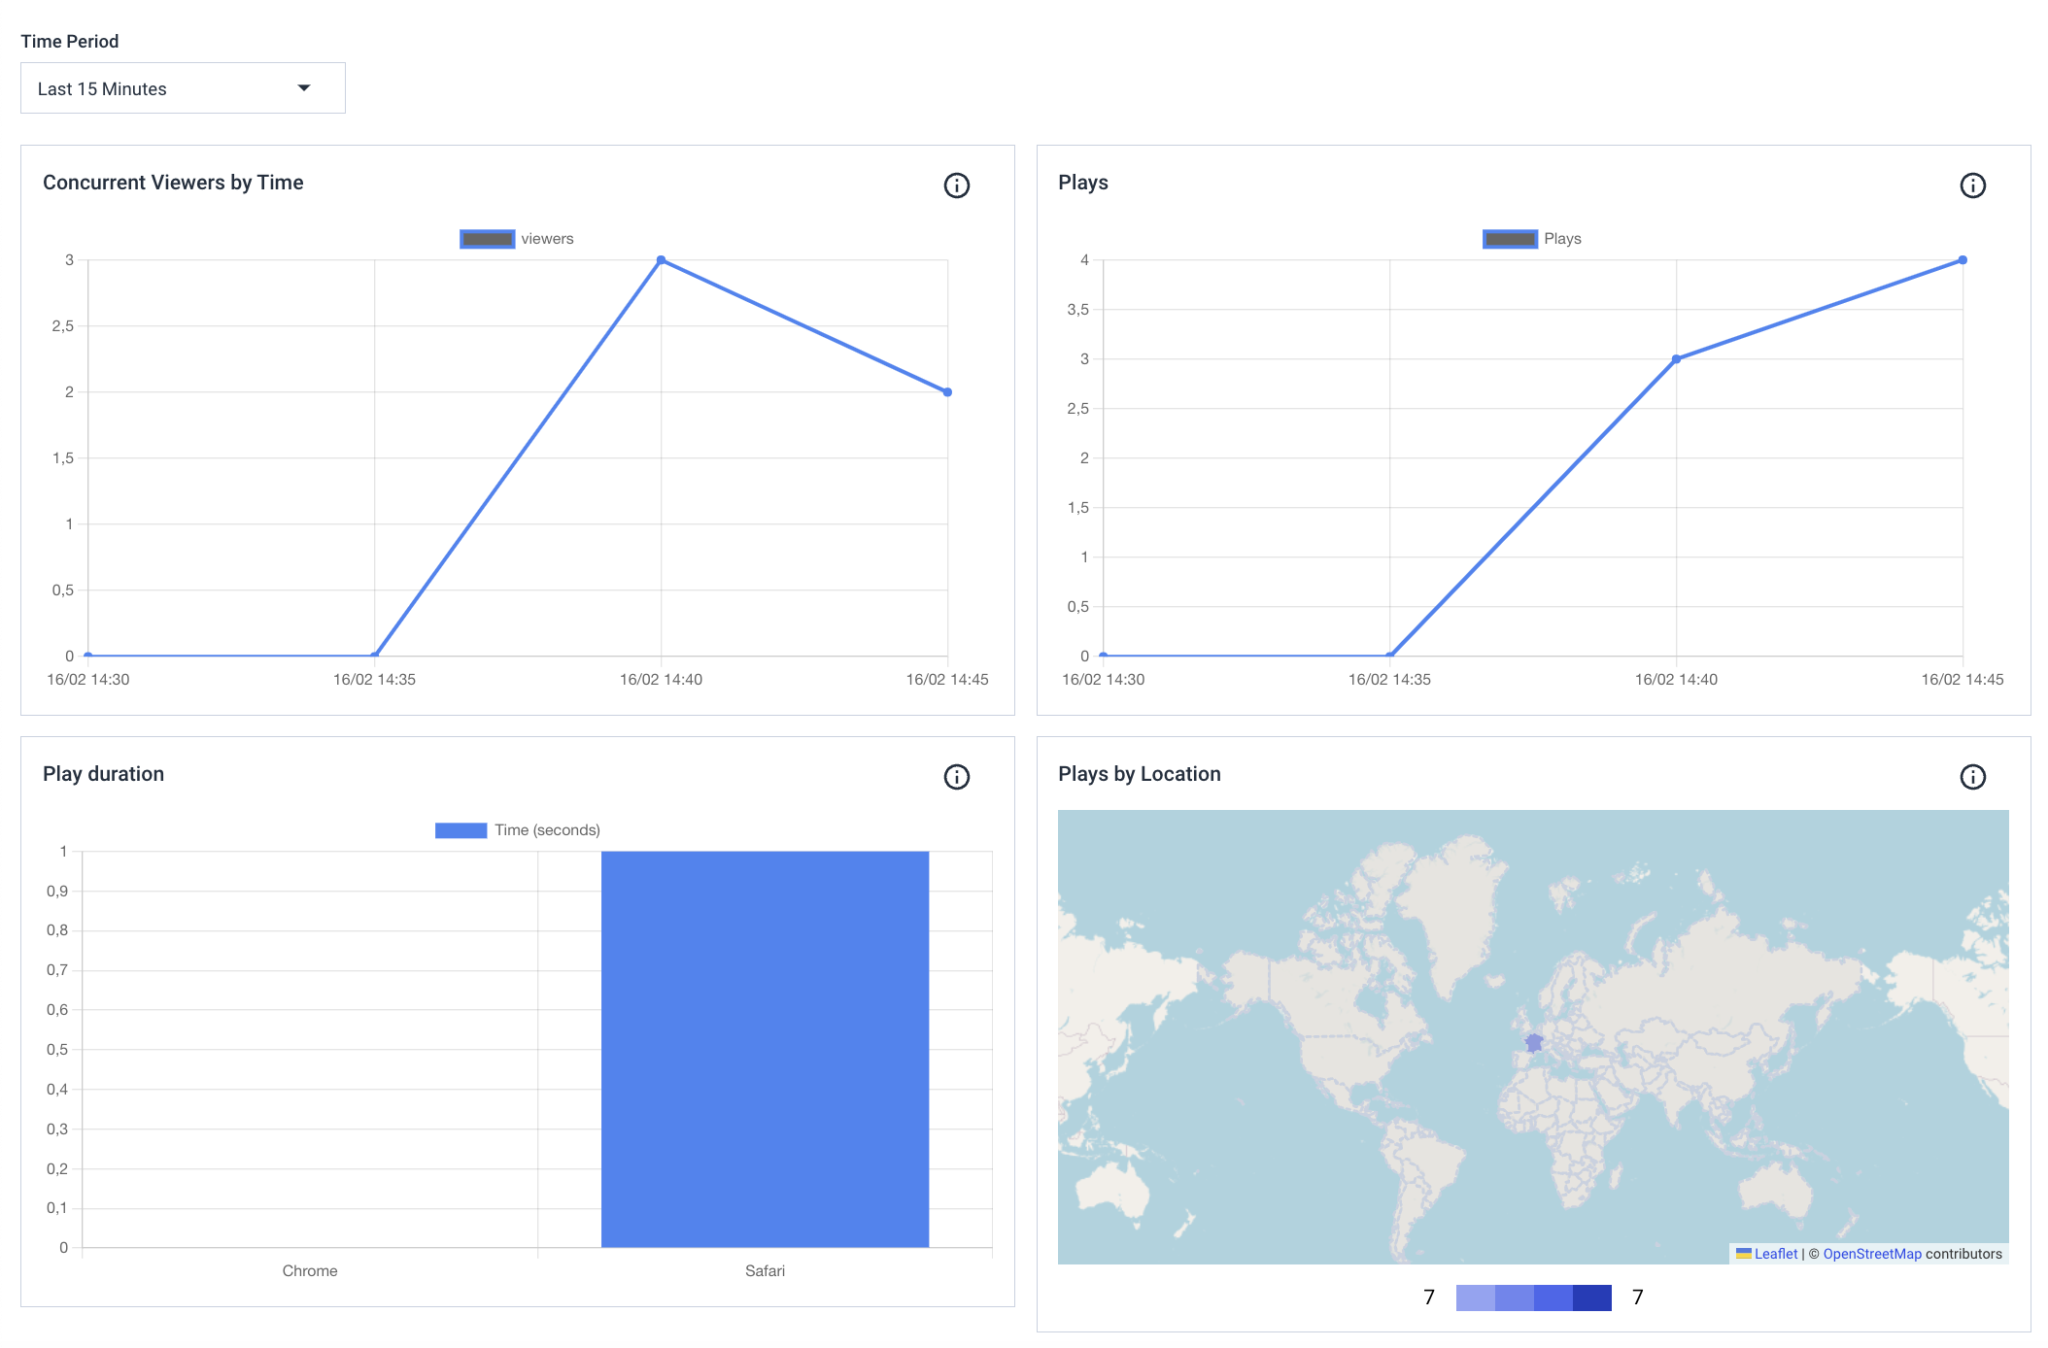
4. Real time video analytics
The fourth type of analytics reporting you can observe exists for live streams only. It’s the real time video analytics option, which allows you can see how your audience interacts with your content in real time.
For Audience, Paywall, Engagement and Real time video analytics reports, you can export the tables in CSV format with this button available below the graphs.
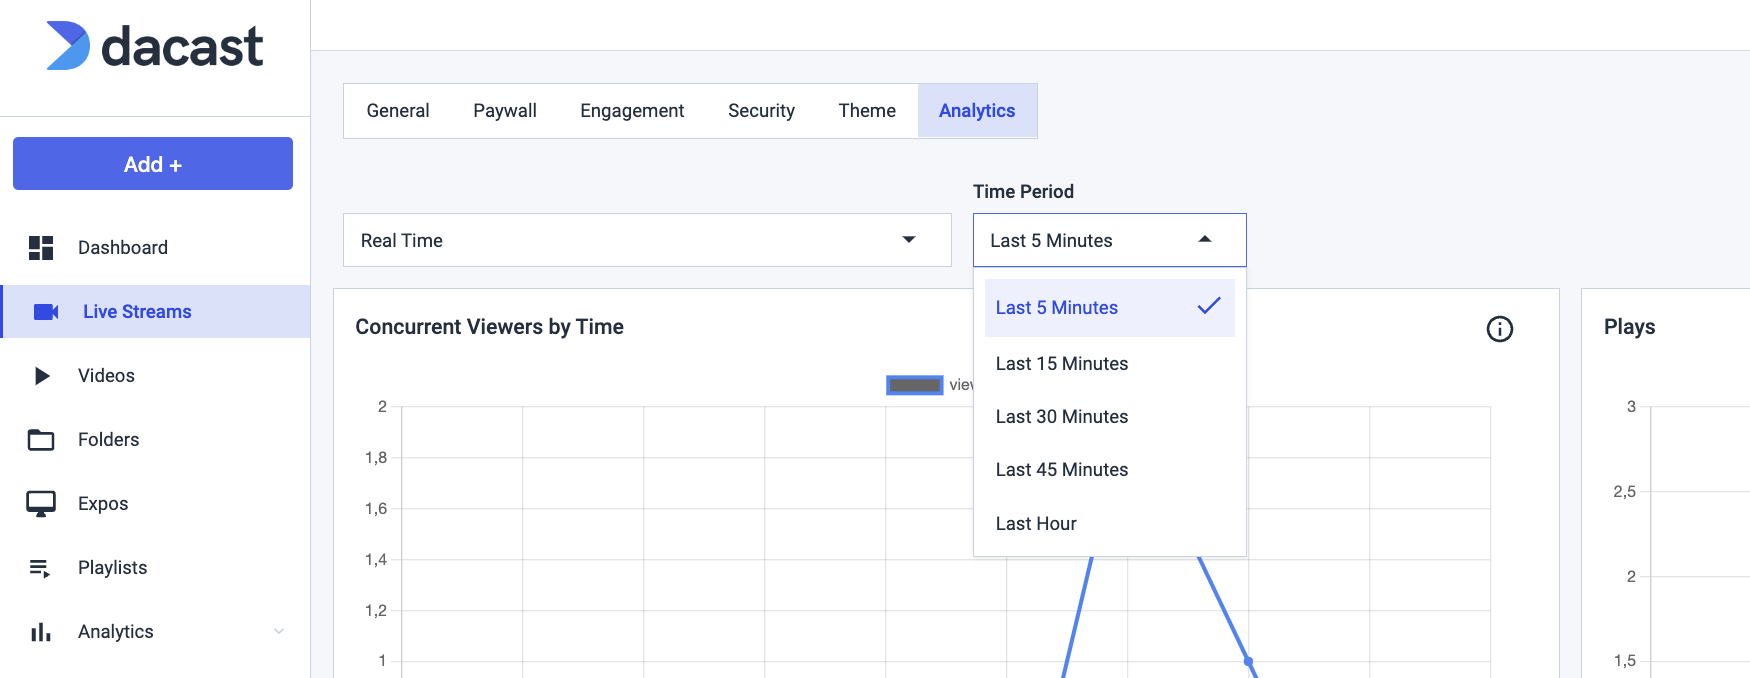
Note that for the real time video analytics (live streams only), the time range will differ slightly, as your live streams are observed for a specific time/hours. You will be able to observe your live stream from the last 15 minutes to last hours:
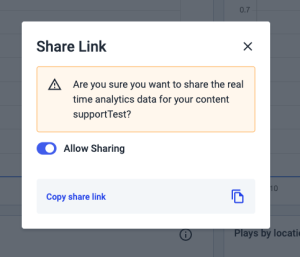
Real time Analytics gives you real time stats about your Live Stream. Now you can even share those charts via the Real Time Analytics sharing feature. Just click on Share Link in the upper right corner.
As you can see, Dacast per content analytics gives you a precise snapshot of your content performance and the revenue generated with easy-to-read graphs and tables.
If you have any questions about Dacast Analytics or any other Dacast feature, please check out our knowledge base, or contact our 24/7 support team.
Not yet a Dacast user, and interested in trying Dacast risk-free for 14 days? Sign up today to get started.
Additional Resources
- Explore Real-Time Analytics on Dacast
- Dacast Analytics Dashboard: An Intro to Key Features
- How to Link Google Analytics to Your Dacast Account
- How to Access and Read Your Analytics Revenue from Dacast
- New Advanced Video Analytics VOD and Live Streaming
- How Long Does it Take for the Dacast Analytics Dashboard to Populate?
- Dacast Revenue Analytics: How to Read the Graphs
- Dacast Analytics: How to Read the Graphs
- Dacast’s Analytics Dashboard: How to read the graphs
- More on Advanced Analytics