


New Advanced Video Analytics for VOD & Live Streaming

Here at Dacast, we’re constantly innovating in online video. In the last year, we’ve added a bunch of new features to our online video platform. Most recently, we released our HLS Direct low latency streaming solution, in conjunction with a new, more powerful video player. Our latest feature is a new, advanced video analytics dashboard. Among other noteworthy features, these advanced video analytics provide our users with powerful insights on viewers and video content.
Our advanced video analytics feature captures a wide range of data about people viewing your live streams and video-on-demand. Furthermore, the Dacast platform presents this data via a compelling, powerful user interface that makes it easy to pick out patterns and drive good business decisions.
In this article, we’ll describe these new features, as well as discuss how you can use them in your business. First, however, let’s start with an overview of our new video analytics dashboard.
Dacast’s new video analytics dashboard
Online video is growing explosively. Hours viewing online video grew 114% in Q1 2018, as compared to the same time the previous year. These numbers continue to rise month after month. The question is: how can you maximize your audience and improve your bottom line?
 Dacast’s new analytics dashboard aims for broadcasters to gather actionable data about viewers. This is a great feature available to all of our users. Some platforms, like IBM Cloud Video, limit analytics to users on high cost ($399/month and up) plans. With Dacast, however, users at all plan levels have access to our new video analytics dashboard.
Let’s dive in now and look at some details of our real-time video analytics!
Real-time video analytics for live streaming and VOD
 Analytics for Dacast live streams provide data while your live broadcasts are in progress. As mentioned above, many video platforms (such as Wowza) don’t include this feature at all, on any plan level.
To find this data, simply navigate to your Dacast back office, click the analytics button, then select “Real-Time” in the menu.
Next, you can select a live channel. If that channel is currently broadcasting, data feeds will appear and begin to populate. Four types of information will appear:
- Concurrent viewers (displays the average number of concurrent playback sessions over time)
- New viewers (helps to track the rate at which new viewers are accessing the live stream in real-time)
- Data consumed (provides a total view of the amount of bandwidth that is used by all of your viewers around the world)
- Data consumption by country (shows how much data is being used in all countries globally in real-time)
Users can choose to display this information on the map, table, or chart formats. You can also select a custom time period to analyze. The default timing is the last 5 minutes, with data updating every 5 seconds. To access data older than 2 hours, you can visit your main analytics dashboard.
This feature is available on all HTML5 and HLS Direct low latency live channels. Additionally, all Dacast plan levels now include access to this feature. This is a huge advantage compared to most of the other streaming solutions in the industry. Most platforms usually offer real-time analytics starting at the second or third plan level.
Better user interface for video analytics
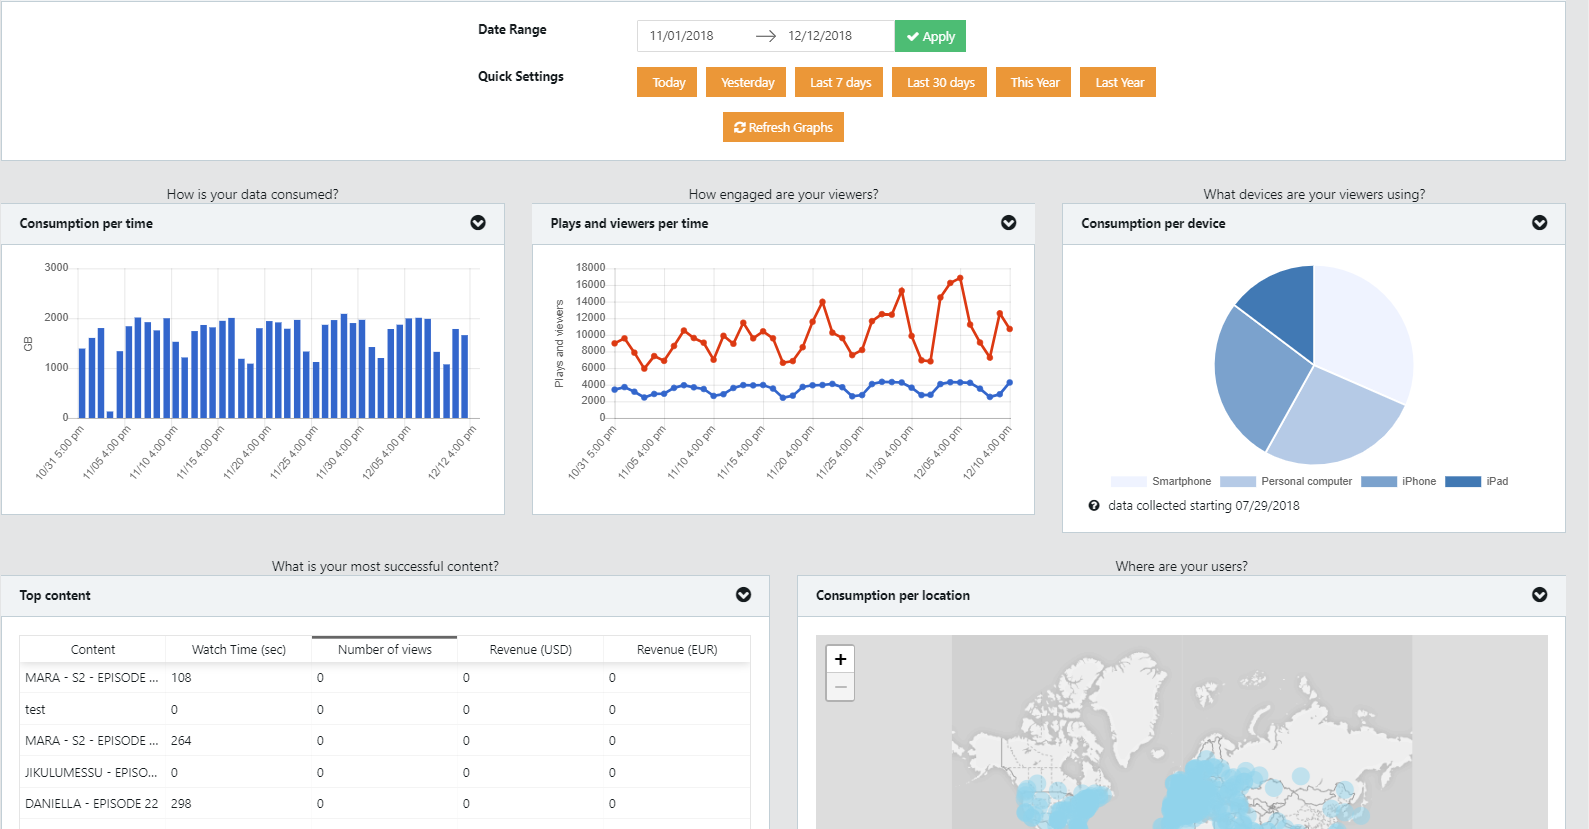
Besides support for real-time video analytics and additional metrics, the Dacast video streaming platform is also upgraded to offer you a full revamped analytics section. The new UI presents data more clearly and cleanly, and it allows you to customize the display of data.
Features of the new UI include:
- Clean new graphs and tables
- Map option to show a geographic range of data consumption
- Easily switch between different views
- Quick filters to switch between different time ranges
- Easily compare the performance of up to five videos/live channels
- Automatically set to your local timezone
Ultra-detailed viewer analytics
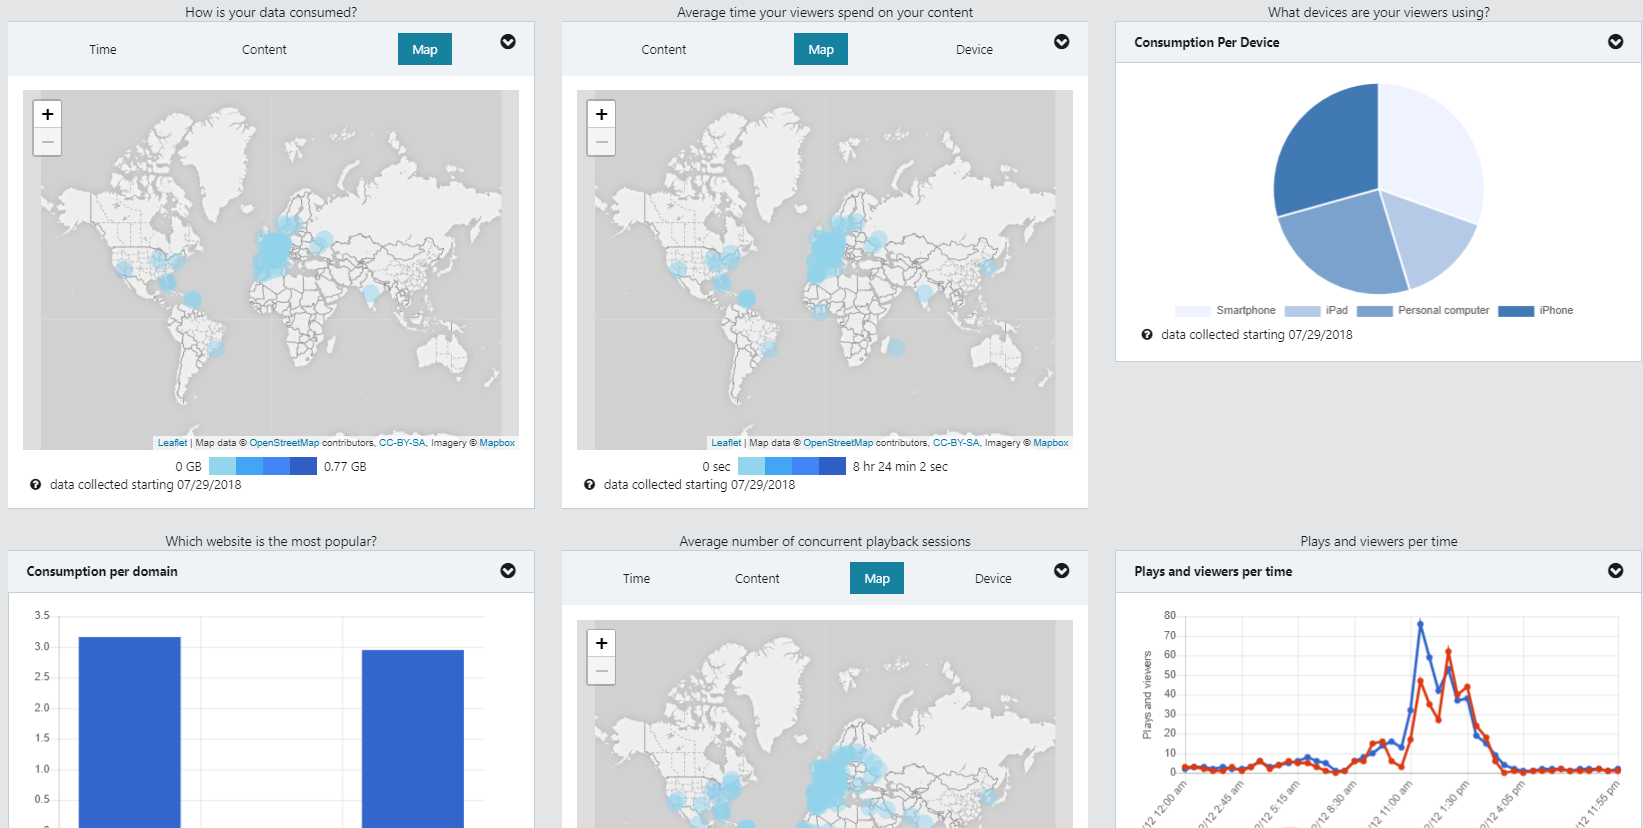 One of the most powerful features of our new Dacast video analytics dashboard is the ability to track viewership information in much more detail. The new dashboard allows you to track the following:
Data consumption, per:
- video or live channel
- city
- device type
- domain
- as well as overall data consumption over time
Average time watching, per:
- video or live channel
- city
- device type
The average number of concurrent playback sessions, per:
- Any given time interval
- video or live channel
- city
- device type
Plays and viewers
- Overtime
- Per country
How to use Dacast’s advanced video analytics for your business
This level of detail is extremely useful to a business. Among other benefits, this sort of data allows you to analyze the success of your content in great detail. And this analysis, in turn, involves the process of making data into actionable insights.
According to Brent Dykes at Forbes, the differences between data, information, and insights are as follows:
“Data is the raw and unprocessed facts that are usually in the form of numbers and text. It can be quantitative (measured) or qualitative (observed). Data primarily exists in computer-friendly formats and mostly lives in databases and spreadsheets.
Information is prepared data that has been processed, aggregated, and organized into a more human-friendly format that provides more context. Information is often delivered in the form of data visualizations, reports, and dashboards.
Insights are generated by analyzing information and drawing conclusions. Both data and information set the stage for the discovery of insights that can then influence decisions and drive change. […] Actionable insights sit at the apex of your data pyramid.”
Likewise, according to Techopedia, “[a]ctionable insight is a term in data analytics and big data for information that can be acted upon. […] In short, it is an analytics result that provides enough data for managers and organizations to make an informed decision.”
Actionable applications of video analytics
So how can you take the data you gather with Dacast advanced video analytics and make it actionable? According to Dykes, the key attributes that make data actionable are:
- Alignment (the most useful data, rather than unimportant or side information, tracks key performance indicators)
- Context (understanding data in its proper context)
- Relevance (delivering data to the right people who can understand it, and act on it)
- Specificity (specific data is more actionable)
- Novelty (data is more actionable if it is new, or if no one has yet acted on it)
- Clarity (clearly communicating data)
Data is important. But without applying human intelligence, data is just a number on a screen. Forrester reports that nearly 75% of businesses say they want to be “data-driven,” yet only 29% are actually successful at connecting analytics to action.
Businesses can use Dyke’s six guidelines to narrow in on the most important analytics, to determine what these numbers mean, and to communicate them to people inside the organization.
With these tips, you too can make the most of the video analytics data you gather.
Exporting video analytics and APIs
 Finally, let’s briefly talk about exporting analytics data from our live streaming platform. Our new dashboard makes it easy to export all your analytics data from any screen in a CSV format. You can also link Google Analytics directly to your Dacast account.
It’s also possible to access and export your analytics data via Dacast Video Content Management API. Most businesses are migrating to API-based workflows for online video. The use of all types of APIs is exploding. The number of public APIs available to developers has more than tripled, and private APIs are more popular than ever.
Conclusion
We are pleased to offer this new analytics dashboard to all our users! We hope the article has served as a useful introduction to our new video analytics features. Furthermore, we hope you now better understand how to use analytics data to track and improve the performance of your video assets.
If you’re using Dacast already, this feature is available to you now. If not, we hope you’ll consider giving Dacast a try! Dacast offers its broadcasters a comprehensive and user-friendly solution for video hosting and live streaming. Interested in learning more?
Why not take advantage of our free 30-day trial (no credit card required). That way, you can test the Dacast features for yourself before committing!
For exclusive offers and regular live streaming tips, you’re welcome to join our LinkedIn group. Have further questions, thoughts, or feedback about this article? We’d love to hear from you in the comments below.
Thanks for reading, and good luck with your broadcasting.